




What is data analytics for marketers? A practical guide
Learn what data analytics for marketers means, the four types that matter, which metrics to track, and how to start in 90 da...





Most marketing teams sit on more data than they can use. It lives in Google Analytics, the ad platforms, the CRM, the email tool, and a stack of spreadsheets. The numbers rarely agree, so people stop trusting them and fall back on gut feel. That is the gap this guide closes.
Here you will learn what marketing data analytics actually is, the four types that matter, which metrics deserve attention, how to read attribution honestly, and how to start in your first 90 days. The goal is practical. By the end you should know what to measure, what to ignore, and what to do next.
Data analytics for marketers is the practice of collecting marketing data, analyzing it across sources, and turning the result into decisions that improve performance. It answers four questions in order: what happened, why it happened, what will happen next, and what to do about it. The point is action, not dashboards.
Ready to grow your organic traffic?
Get a free SEO audit from the Launchcodex team.
Analytics is a decision system, not a reporting habit. A report tells you clicks rose 12 percent. Analytics tells you why, whether it will hold, and where to move budget next. That shift from watching numbers to acting on them is where the value sits.
The stakes are rising fast. The global marketing analytics market reached about 7.12 billion dollars in 2025 and is growing at a double-digit annual rate into the early 2030s. More spend means more pressure to prove that marketing drives revenue, not just activity.
Speed is the clearest payoff. Companies with strong data cultures make decisions roughly five times faster than peers who rely on instinct, according to a roundup of McKinsey and Gartner research. Faster, better decisions compound across every campaign you run.
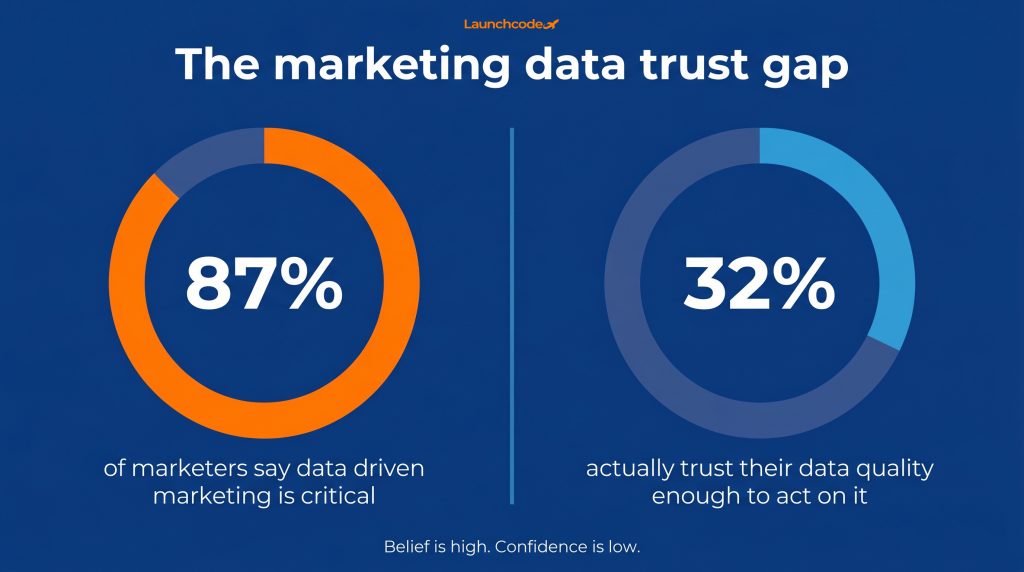
Here is the paradox. 87 percent of marketers say data-driven marketing is critical, but only 32 percent trust their data quality enough to support those decisions. Belief is high. Confidence is low. Analytics fails most often not because the math is wrong, but because the data feeding it is dirty. Fix that first.
"Before a client buys anything, I ask one question: do you trust your own numbers? Nine times out of ten the answer is no, and that tells us where to start." Derick Do, Co-Founder and Chief Product Officer
Marketing analytics splits into four types that build on each other. Descriptive analytics shows what happened. Diagnostic analytics explains why. Predictive analytics forecasts what is likely next. Prescriptive analytics recommends what to do. Most teams do descriptive well and stop there, which leaves the highest value work untouched.
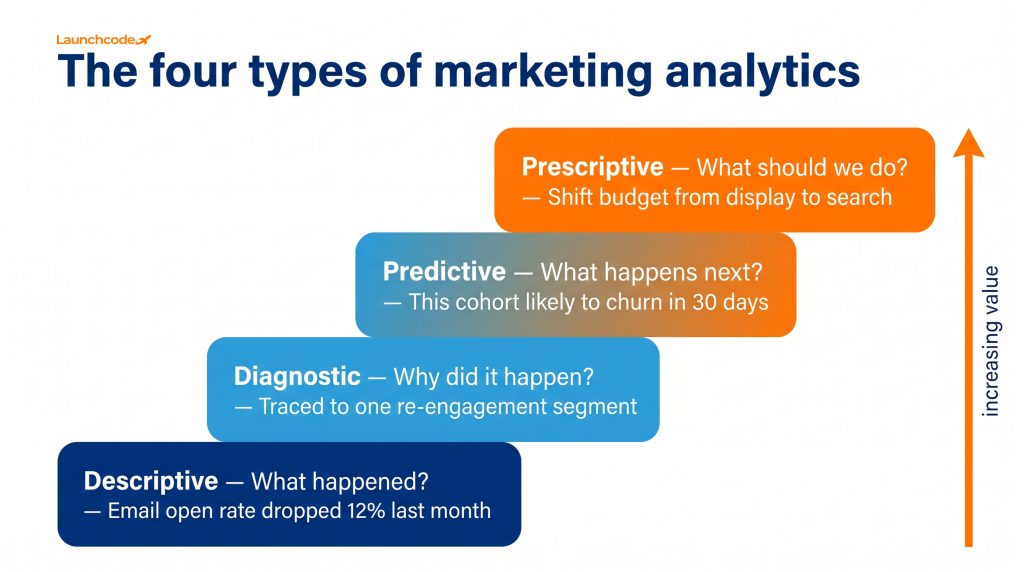
Treat the four types as a ladder, not a menu. You cannot predict reliably until you can explain, and you cannot explain until you can measure cleanly. Climb one rung at a time and confirm the rung below is solid before you step up.
| Type | Question it answers | Example | Starter tool |
|---|---|---|---|
| Descriptive | What happened? | Email open rate dropped 12 percent last month | Google Analytics 4, HubSpot reporting |
| Diagnostic | Why did it happen? | The drop traces to one re engagement segment | GA4 explorations, Looker Studio |
| Predictive | What will happen next? | This cohort is likely to churn in 30 days | Built in platform models, predictive CRM features |
| Prescriptive | What should we do? | Shift budget from display to search this week | Improvado, SegmentStream, MMM models |
A SaaS team sees signups fall 15 percent (descriptive). They dig in and find paid search held steady while organic landing pages slowed after a site change (diagnostic). A model flags that the trend will deepen next month if nothing changes (predictive). The recommended move is to roll back the page change and reallocate spend to the pages still converting (prescriptive). Same data, four levels of value.
Most organizations have solid descriptive analytics and little else. The jump from diagnostic to predictive is where effort pays off, but it only works on clean inputs. Do not buy a prescriptive platform while your descriptive numbers still disagree across tools.
Track metrics that tie to revenue, not metrics that flatter a slide. Customer acquisition cost, customer lifetime value, return on ad spend, conversion rate, and pipeline influenced by channel are the ones that drive decisions. Impressions, raw followers, and unfiltered traffic are vanity metrics until you connect them to an outcome.
The test is simple. If a number changes, would you do anything differently? If not, it is probably a vanity metric. Build your reporting around the few figures that change behavior.
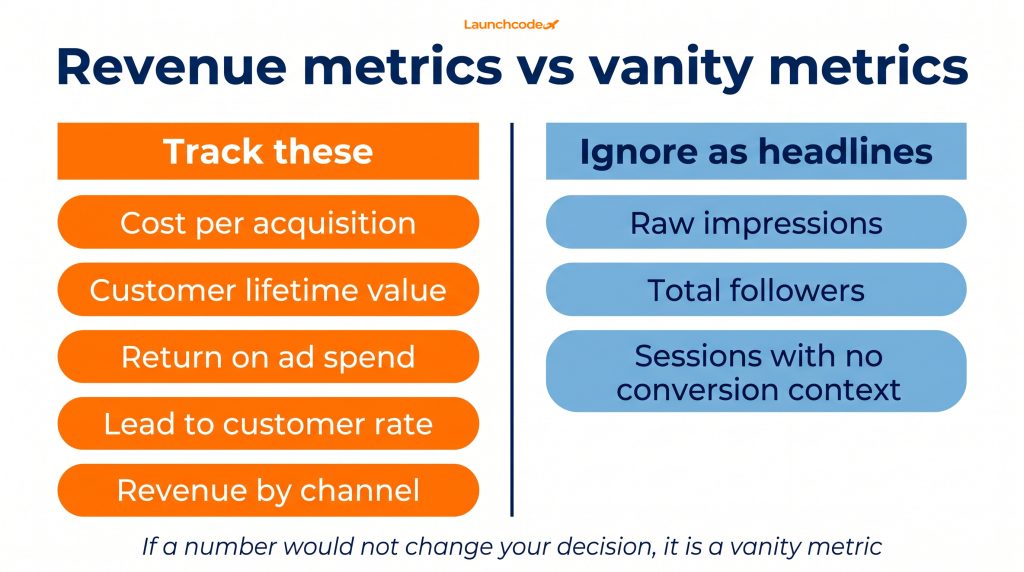
Teams often report what is easy to pull, not what matters. Platform dashboards make impressions and clicks frictionless, so those become the story. Start from the business question instead. Decide the decision first, then choose the metric that informs it.
"We tell clients to pick five revenue metrics and kill the rest from the main report. CAC, LTV, ROAS, conversion rate, revenue by channel. A shorter report gets read and acted on." Tanner Medina, Co-Founder and Chief Growth Officer
You cannot trust your marketing data because most of it is incomplete, inconsistent, or stitched together from tools that count differently. Roughly 45 percent of the data marketers use is incomplete, inaccurate, or out of date, and 43 percent of CMOs believe less than half of their data can be trusted. Bad inputs produce confident, wrong answers.
This is the most ignored part of marketing analytics, and the most important. 67 percent of CMOs admit they do not trust the data they use for decisions. Research from Precisely across more than 550 data professionals reached the same point: the bottleneck is no longer access to data but confidence in it. More data, less trust.
The price is real. Poor data quality costs the average organization about 12.9 million dollars a year, per Gartner figures. When CMOs were asked what would most improve marketing performance, the top answer was improving data quality at 30 percent, ahead of automating workflows. Fixing the foundation beats buying more software.
At Launchcodex, we set up tracking and reporting in this order on purpose, foundation before dashboards, because a unified, trusted view is what makes every later decision faster and safer.
Honest attribution means accepting that no model is perfectly accurate and choosing one that fits how your customers actually buy. 38 percent of marketers call attribution their number one analytics challenge, and 22 percent still rely only on last click. Last click is simple and usually wrong, because it gives all credit to the final step.
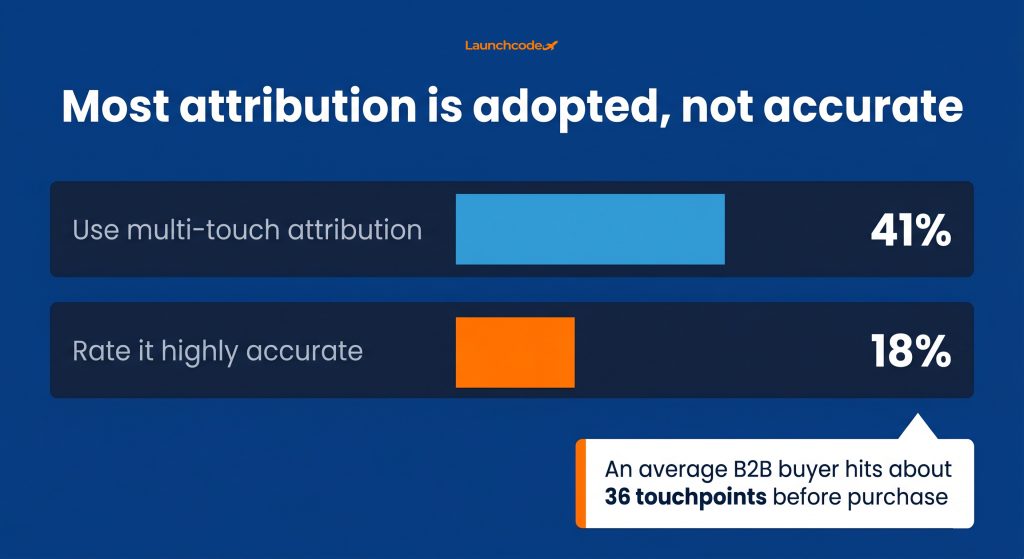
The problem is the journey. An average B2B buyer hits about 36 touchpoints before purchase. Crediting only the last one tells you almost nothing about what built the demand.
| Model | Who it fits | Key strength | Watch out for |
|---|---|---|---|
| Last click | Tiny teams, short journeys | Easy to run | Ignores everything before the final touch |
| Multi-touch (MTA) | Digital heavy funnels | Spreads credit across touches | Accuracy suffers from privacy signal loss |
| Marketing mix modeling (MMM) | Omnichannel and offline spend | Works without per user tracking | Needs more data and statistical effort |
Be honest about limits. Multi-touch attribution adoption has reached about 41 percent, yet only 18 percent of those setups are rated highly accurate by the teams running them. Use attribution to guide budget direction, not to claim false precision. A layered approach, MTA for digital detail plus MMM for the full picture, beats trusting one model alone. Honest attribution also feeds smarter performance media planning and buying, where budget moves on direction rather than guesswork.
"Stop chasing perfect attribution. We run multi-touch for the digital detail and a mix model for the full read, then make budget calls on the direction both point to." Tanner Medina, Co-Founder and Chief Growth Officer
Privacy rules shrink the data you can collect, and AI raises the value of the data you keep. GDPR and CCPA, plus cookie and tracking limits, create signal loss that breaks old measurement. The response is first-party data you collect directly, paired with AI that pulls more insight from a smaller, cleaner dataset.
These two forces pull in opposite directions, and that tension defines analytics right now. You have less raw tracking, but better tools to use what remains.
With third-party signals fading, owned data matters more. Leading marketers are 72 percent more likely than the mainstream to invest in first-party data quality and volume. Email lists, on-site behavior, and CRM records are now core assets, not afterthoughts.
AI is not a shortcut around bad data. Organizations in the top quartile of AI analytics adoption report 3.2 times higher marketing ROI, while the bottom quartile report no measurable gain at all. Implementation quality decides the result. The pressure is clear too, since 76 percent of business leaders say AI increases their need to be data-driven, including 83 percent of marketing leaders. This is where marketing automation earns its keep, but only on inputs you have already cleaned.
Do not point an AI model at messy, inconsistent data and expect insight. You will get fast, confident, wrong answers. Clean and define your data first, then let AI find patterns in it.
"We watched two clients adopt the same AI reporting layer. The one with clean inputs cut reporting time in half. The one with messy data just got wrong answers faster." Derick Do, Co-Founder and Chief Product Officer

Start small and sequence it. In the first month, fix data quality and define your metrics. In the second, build a trusted dashboard around revenue metrics. In the third, add diagnostic depth and a basic attribution model. Hold off on buying a big platform until the foundation holds.
A lean team with no analyst can do all of this. The trap is jumping to predictive tools before the basics work. Order beats ambition.
Marketing data analytics is not about collecting more numbers. It is about trusting a few of them enough to act. The teams that win are not the ones with the biggest stack. They are the ones who cleaned their data, defined one clear question, and built a measurement habit around revenue.
Start with the foundation. Fix data quality, choose metrics that change decisions, read attribution honestly, and add AI only once your inputs are clean. If you want a partner to set up the data infrastructure and analytics behind that work, that is exactly the kind of system we build. Your next step is simple: pick one revenue metric this week, define how you measure it, and build a single trusted view around it. Everything else compounds from there.
Reporting shows what happened. Analytics explains why, predicts what is next, and recommends what to do. Reporting is a snapshot. Analytics is a decision system built on top of it.
Yes. Small teams gain the most because every budget decision matters more. You do not need a large stack. You need clean data, a few revenue metrics, and one trusted dashboard. Many small businesses start with one dashboard and grow from there.
Customer acquisition cost, customer lifetime value, return on ad spend, and conversion rate. These tie directly to revenue. Impressions and follower counts are vanity metrics unless you connect them to an outcome.
Customers touch many channels before buying, often around 36 for B2B. No model captures that perfectly, and privacy rules reduce tracking data. Pick a model that fits your journey and use it for direction, not false precision. The same logic applies to SEO and GEO reporting, where organic credit is easy to misread.
No. AI amplifies whatever you feed it. Clean and define your data first. Teams with strong data see large ROI gains from AI, while teams with messy data see none. For more on this, see our work on AI automations.




Learn what data analytics for marketers means, the four types that matter, which metrics to track, and how to start in 90 da...
WordPress ships with no SEO configuration. This guide covers the correct setup order: plugin choice, permalink structure, sc...
84% of patients check reviews before choosing a plastic surgeon. Learn how to generate reviews at scale, respond without HIP...