
Share:

AI marketing & automation


Most marketers run A/B tests. Far fewer trust the results. They ship a variant after a strong day three, watch the lift vanish by day fourteen, and never learn why. The problem is rarely the idea. It is the process around it.
This guide gives you a process you can run on Monday. You will learn what to test first, how much traffic you need, how to read statistical significance without fooling yourself, and what to do when a test shows no winner. Every step connects to a real outcome: more qualified leads, higher revenue per visitor, and decisions you can defend.
An A/B test compares two versions of a page, email, or ad by splitting traffic between them and measuring which drives more of a target action. Version A is the control. Version B is the variant. The test only earns its value when the process is disciplined enough to produce a result you can trust.
The mechanics are simple. The discipline is not. Ronny Kohavi, who led experimentation at Microsoft and Airbnb and co-wrote Trustworthy Online Controlled Experiments, puts the real challenge plainly: getting numbers is easy, and getting numbers you can trust is hard.
The basic A/B format dominates for a reason. It works with modest traffic and produces a clear answer. According to Convert’s experiment data, A/B tests account for 67.6% of all experiments, well ahead of split URL tests at 16.9% and multivariate testing at under 1%. Multivariate testing sounds capable, but it needs far more traffic to isolate each combination. For most teams, a clean A/B test answers the question faster.
The benchmark for a valid result is a 95% confidence level. Yet field research summarized by Reform shows only about 20% of tests actually reach it. That gap is the whole problem. Teams launch tests, get impatient, and act on noise.
“Most of the tests I see fail before they start. The team never set a finish line, so they stop the day the dashboard looks good. The fix costs nothing. Decide your sample size first.” Derick Do, Co-Founder and Chief Product Officer
Test the changes that move money, not the ones that are easy to build. Headlines, offers, pricing presentation, and checkout flow carry far more weight than button color. Pick one high-traffic page, form one clear hypothesis, and change one variable so you know exactly what caused the result.
Prioritization is what separates a structured program from random tinkering. TrueList reports that 56.4% of companies use a test prioritization framework. The other half tend to test whatever is convenient, which is why their results rarely compound.
Score each idea on three factors, then test the highest scores first.
Tools like Hotjar, Microsoft Clarity, and FullStory feed the confidence score. They show where users hesitate, scroll past, or abandon. That friction is your hypothesis source.
Small changes rarely move the number enough to matter. A Qubit meta-analysis of 6,700 online experiments, independently assured by PwC and reported by Blend, found that 90% of experiments changed revenue by less than 1.2% in either direction. The lesson is direct. Test a completely new headline or a restructured offer, not a slightly different shade of blue. Bigger changes are also easier to detect, so they need less traffic to reach significance.
A B2B site wanted more demo requests. The team’s first instinct was to test a green button against a blue one. Analytics showed the real drop-off happened above the fold, where visitors did not understand the offer. Reframing the headline around a specific outcome lifted demo requests far more than any button color test could have, because it fixed the actual reason people left.
You need enough traffic to detect a real difference, not a fixed number of days. A common working floor is at least 1,000 unique visitors and 100 conversions per variant before you draw conclusions. Calculate your exact target before launch using your baseline conversion rate and the smallest lift you care about.
Underpowered tests are the top reason results never reach significance. If your traffic is thin, you have three options: test bigger changes, run the test longer, or test your highest-traffic page first.

Your required sample size depends on three numbers, not guesswork.
Plug these into a free sample size calculator, such as the one from Evan Miller, before you launch. That number becomes your finish line.
Timing skews results. If you run version A this week and version B next week, you cannot separate the design change from the day of the week, a promotion, or a traffic shift. Always split traffic at the same time and keep the same visitor on the same version across visits.
Use this as a starting point, then confirm with a calculator. These numbers shift with your minimum detectable effect.
| Baseline conversion rate | Rough visitors per variant | Best for |
|---|---|---|
| Under 2% | 25,000 or more | Ecommerce, paid traffic |
| 2% to 5% | 10,000 to 20,000 | B2B lead gen, signups |
| 5% or higher | 5,000 to 10,000 | Landing pages, email clicks |
These are directional. Always calculate against your own baseline and target lift before launch.
Statistical significance at 95% means that if there were no real difference between A and B, you would see a result this extreme only 5% of the time by chance. It does not mean there is a 95% chance your variant is better. That misreading causes teams to ship losing tests with full confidence.
The p-value is the engine behind significance. It is the probability of seeing your result, or a more extreme one, if the variant had no real effect. A low p-value is evidence against the idea that nothing changed.
The 95% threshold is a shared standard, not a guarantee. Convert’s data shows 70% of its 2025 experiments reached 95% confidence and 49% reached 99%, which signals a maturing field. Higher confidence means fewer false winners, but it also takes more data. For a major decision like a pricing change, push for 99%. For a low-risk tweak, a directional read may be enough to shape your next hypothesis.
Significance tells you a difference is real. It does not tell you the difference matters. Always check two things together: the primary metric you set in advance, sometimes called the overall evaluation criterion, and a guardrail metric that catches harm. A variant might lift clicks while quietly hurting checkout completion. Watch both.
“We tie every test to one primary metric and one guardrail before launch. On a recent client test, click-through rose 9% while checkout completion dropped. The guardrail caught it. Without it, we would have shipped a loss.” Tanner Medina, Co-Founder and Chief Growth Officer
Stopping a test the moment it looks like a winner is the most expensive mistake in A/B testing. Each time you peek and stop at significance, you take another roll of the dice. Evan Miller’s widely cited analysis shows that checking after every batch and stopping at p below 0.05 raises the real false positive rate from 5% to 26.1%.
This is the peeking problem, and it breaks the math most testing tools rely on. Classical significance calculations assume you set your sample size in advance and look once at the end.
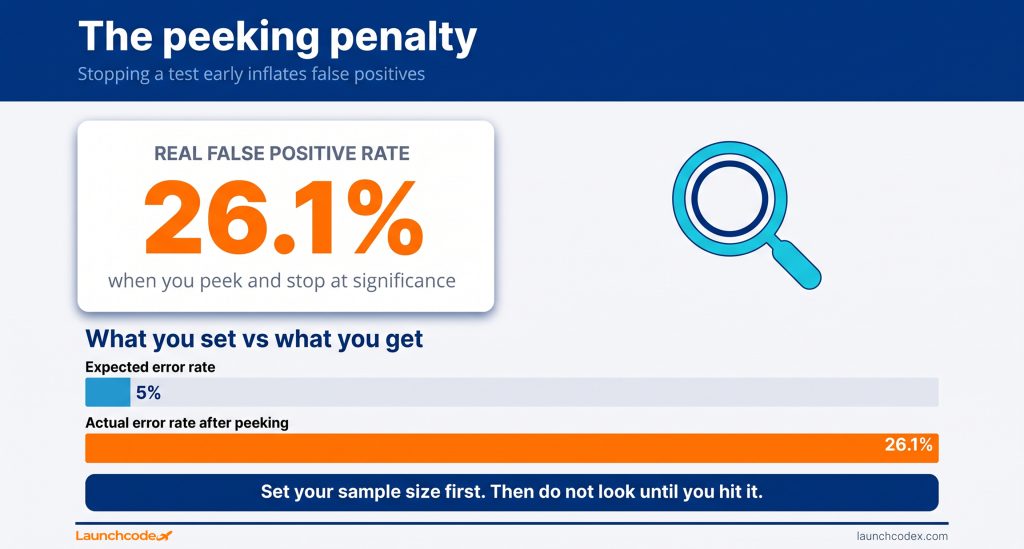
Ramesh Johari and co-authors explain in their academic paper on peeking that standard test measures are computed under the assumption that the sample size was fixed in advance. Every extra look adds a new chance to cross the threshold by luck. Research summarized by Atticus Li shows that peeking five times and stopping at significance pushes the false positive rate above 20%.
An apparent 20% lift on day five regularly collapses into noise by day fourteen. Early numbers swing widely because the sample is small. The fix is discipline, with two valid paths.

Watch for these four traps. Each has a clear fix.
Read results against the hypothesis and metric you set before launch, then segment by traffic source, device, and visitor type. A win, a flat result, and a loss are all useful. A losing test removes a wrong direction, which has real compounding value over time.
Most marketers treat a non-winner as wasted effort. That mindset kills testing programs. Set honest expectations from the start.
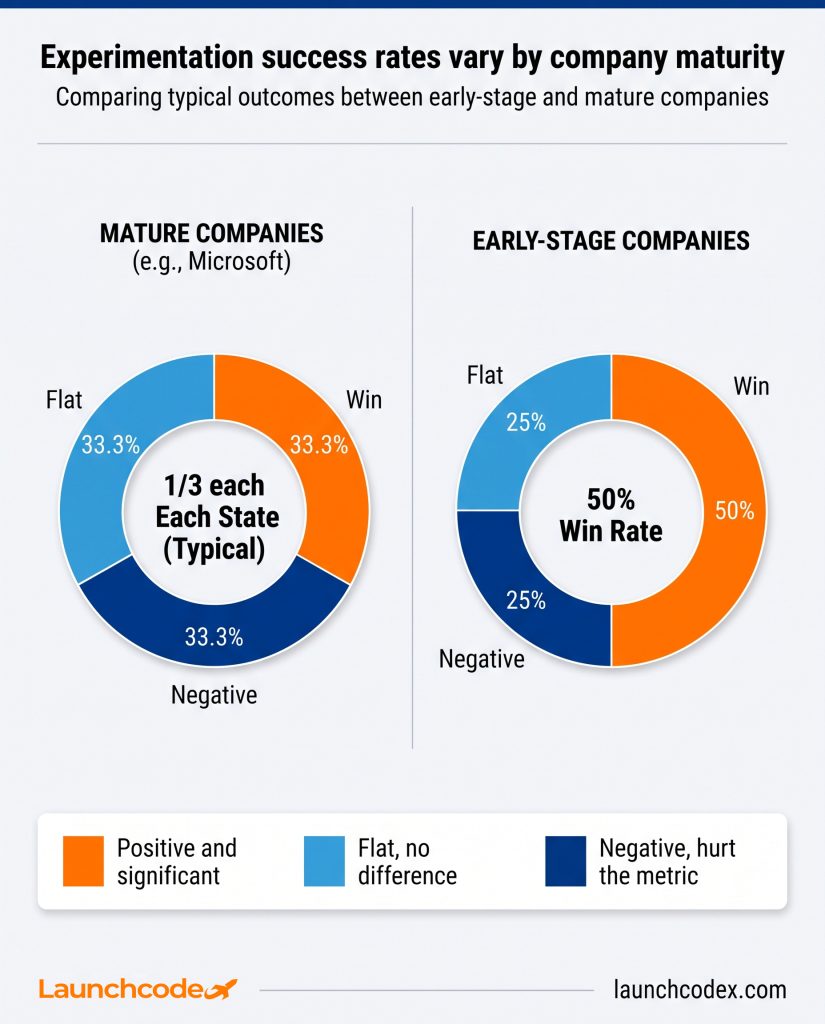
The data is clear and freeing. Convert reports that 60% of completed A/B tests deliver under 20% lift and 84% come in under 50%. Ronny Kohavi’s observations at Microsoft found that roughly one third of tested ideas won, one third were flat, and one third actually hurt the metric, as detailed in his experimentation pitfalls work. Even elite teams see most ideas fail. The return comes from compounding the wins you can trust.
A single average can hide the truth. Traffic source matters enormously. Data from grow-conversions.com shows email converts to landing pages at roughly 19.3%, about seven times better than SEO traffic. A variant that wins overall might lose for organic visitors while winning big for email. Check the result by source, device, and new versus returning users before you roll anything out.
A losing test is a narrowed search space. When you close a test, write down three to five new hypotheses it suggests. This keeps your pipeline full and turns every result, win or loss, into the input for the next experiment.
AI now handles much of the testing workflow, from generating variants to allocating traffic, but it does not repeal the statistical rules. Sample size, significance, and the peeking problem still apply. Treat AI as a faster operator inside a disciplined process, not a replacement for judgment about what a result means.
Adoption is already mainstream. The HubSpot State of Marketing Report, summarized by AZ Big Media, found 92% of marketers say AI has affected their role, with one in five planning to use AI agents to automate strategy.
The same source notes that marketing teams now deploy AI agents for bid optimization, creative rotation, A/B testing, automated reporting, and lead nurturing. In practice, that means AI can:
This is where structured experimentation pays off. At Launchcodex, AI sits inside the testing process by default, speeding up variant creation and analysis while the team holds the line on sample size, significance, and clean test design.
AI accelerates the work. It does not decide whether a 4% lift is real or whether a win in one segment should ship everywhere. Dynamic traffic allocation can also introduce its own bias if it favors early leaders before the data settles. Keep a human accountable for the decision, and keep your guardrail metrics in view.
“AI cuts our variant build time by more than half. It does not decide whether to ship. We still hold the test to 95% significance and read it by segment. The judgment stays with us.” Derick Do, Co-Founder and Chief Product Officer
Run fewer tests, but run them clean. Pick one high-impact change, set your sample size and end date before launch, wait for 95% significance, then segment the result before you act. Discipline beats volume every time.
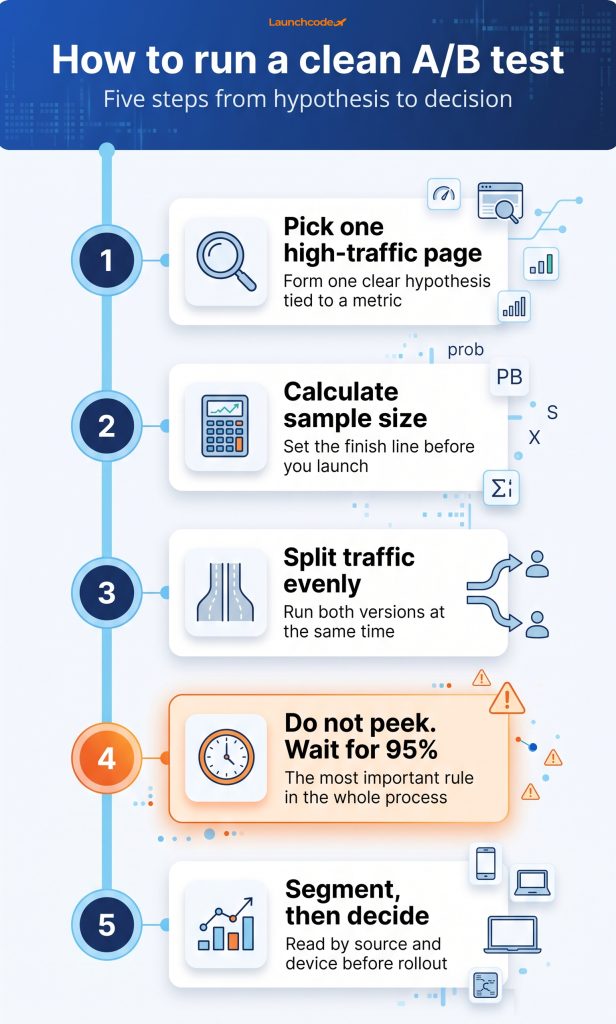
Here is the short version you can put to work this week. Choose a high-traffic page. Form one clear hypothesis tied to a business metric. Calculate your sample size with a free calculator. Split traffic evenly and run both versions at once. Do not peek. When you hit your target, read the result by segment and decide. Then write down the next three ideas the test gave you.
A few well-run experiments you can believe will outperform dozens of rushed tests you cannot. That is the whole game.
Run it until you reach the sample size you calculated before launch, not a fixed number of days. For most sites that means at least one to two full weeks to cover weekly behavior cycles. Stopping early inflates your false positive rate sharply, so commit to your finish line.
A common floor is 1,000 unique visitors and 100 conversions per variant, but your real target depends on your baseline conversion rate and the smallest lift you want to detect. Use a free sample size calculator before you start.
It means that if there were no real difference between your versions, you would see a result this strong only 5% of the time by chance. It is not a 95% probability that your variant is better. Treat it as a quality bar, not a guarantee.
Yes, but adjust your approach. Test bold changes like new headlines or full layout shifts, since large effects need less data to detect. Focus on your highest-traffic page first. If traffic is very low, qualitative research like heatmaps and user interviews may teach you more than a test.
Treat it as a learning, not a failure. A flat result rules out a direction and sharpens your next hypothesis. Check whether the test was underpowered, then write down new ideas the result suggests and move to the next experiment.
Because early results swing on small samples. Each time you peek and stop at significance, you add another chance to lock in a false winner, which can raise your error rate above 26%. Wait for your planned sample size, or use a tool with sequential testing built in.


Real stories from the people we’ve partnered with to modernize and grow their marketing.