


Google I/O 2026: How the new AI search update will change SEO and online visibility
AI Mode, search agents, and Personal Intelligence just changed at Google I/O 2026. Here is the data on what it means for you...


Accuracy, bias, quality, and drift are where most LLM monitoring starts. For teams early in their deployment, that coverage makes sense. But as LLM systems move deeper into customer-facing workflows, revenue operations, and regulated industries, that monitoring stack leaves serious gaps.
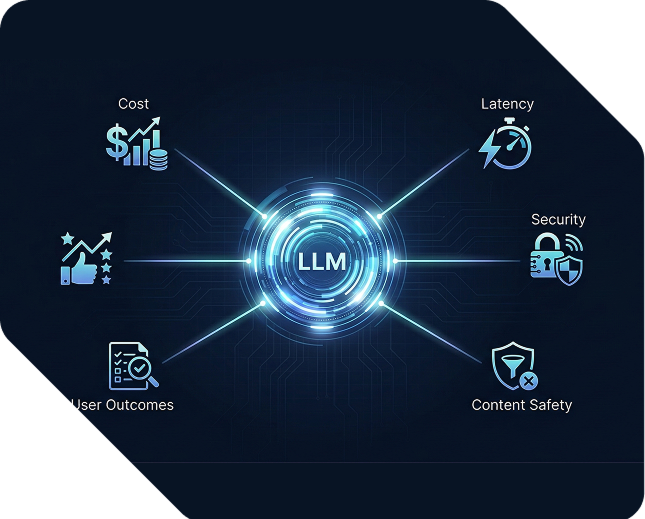
This article maps six production monitoring dimensions that most teams overlook, explains what each one costs when ignored, and gives a clear framework for building a complete observability stack. Every section connects directly to business risk, not just model performance.
The standard LLM monitoring stack covers model performance in isolation. It does not cover cost efficiency, security exposure, regulatory compliance, or whether users are actually completing the tasks they came to do. In production, those gaps create financial, legal, and operational risk that accuracy scores will never surface.
Ready to grow your organic traffic?
Get a free SEO audit from the Launchcodex team.
The challenge is that LLM outputs are dynamic and context-driven. As Logz.io notes in their LLM observability tool guide, ground truth often does not exist for LLM outputs the way it does in classical ML. That makes standard evaluation logic insufficient on its own.
The business data reinforces this. According to research cited in Rohan Paul's LLM production analysis, 75% of businesses observed AI performance declines over time without proper monitoring in 2024, and more than half reported revenue loss from AI errors. Models left unchanged for six or more months saw error rates jump 35% on new data in production.
The AI observability market is now a standalone industry. According to Galileo's LLM observability benchmark report, the market is growing from $1.4 billion in 2023 to a projected $10.7 billion by 2033. Enterprises are buying observability as a critical business function, not a feature add-on.
The six dimensions below are what that investment needs to cover.

Cost per query is a margin metric. Every token your LLM processes costs money. Unoptimized LLM applications can spend 10x more than necessary through inefficient prompting, oversized context windows, or redundant model calls. Teams that skip token efficiency monitoring are eroding the unit economics of every AI-powered feature they ship.
Cost monitoring in production means going beyond monthly API bills. The metrics that matter are:
The FinOps Foundation makes the accountability case clearly: without a robust tagging strategy, it is impossible to hold a specific team accountable for a cost spike or to know whether a new feature is profitable.
Once you can see cost per query, you can act on it. Intelligent model routing can cut LLM spend by 60 to 90% without sacrificing output quality for most use cases. That is a business decision that cost monitoring makes visible.
Semantic caching can cut API costs by up to 73% by reusing prior responses for semantically similar queries. Prompt optimization and RAG tuning add further savings on top.

"The teams that catch cost problems earliest are the ones tagging every API call from day one. By the time costs become visible in the monthly bill, the damage is already done."
Samantha Ramos, Senior Developer
| Cost signal | What it tells you | Action it enables |
|---|---|---|
| Cost per query | Baseline spend per unit of output | Route cheaper models for simpler queries |
| Prompt token ratio | How much of each call is context overhead | Trim or compress system prompts |
| Cost per user | Which user cohorts are most expensive | Redesign flows for high-cost segments |
| Cost by feature | Which product areas drive spend | Prioritize caching or optimization there |
Latency is a user experience metric before it is a performance metric. If your average response time looks acceptable but your P95 latency is three to four seconds higher than your P50, a significant share of your users are having a noticeably worse experience. They will not tell you. They will leave.
Most monitoring dashboards display average latency. Average latency hides the tail. The metrics that reflect real user experience are:
For streaming responses, time-to-first-token (TTFT) matters as much as total response time. Users perceive responsiveness from the moment the first token appears, not when the full response completes.
Throughput monitoring tracks how many requests your system handles per unit of time before latency degrades. This matters during traffic spikes, campaign launches, or onboarding surges. Teams that only monitor average latency in steady state discover throughput limits at the worst possible moment.
Prompt injection is the most common LLM attack vector in production. Standard LLM monitoring tools do not detect it. An attacker who successfully injects instructions into your model's context can override your system prompt, extract sensitive data, generate harmful output, or redirect the model's behavior entirely. Standard accuracy metrics will not flag any of this.
Prompt injection happens when user input or retrieved content includes instructions that override your system-level controls. In a customer support chatbot, a user might type a message designed to make the model reveal internal instructions or ignore safety guardrails. In a RAG system, a compromised document in the retrieval corpus can inject instructions into the retrieved context before the model ever sees the query.
The threat environment is growing fast. Stanford's 2025 AI Index documented 233 AI-related incidents in 2024, a 56.4% year-over-year increase. IBM's 2025 Cost of a Data Breach report found that 13% of organizations reported breaches of AI models or applications in 2024. Of those compromised, 97% lacked proper AI access controls.
The OWASP LLM Top 10 provides the standard taxonomy for LLM security risks. Security-layer monitoring for LLMs covers:
Splunk's security research team frames the stakes directly: failing to build in auditing and granular control mechanisms around an LLM is itself a vulnerability.
Tools like Datadog LLM Observability include prompt injection detection alongside standard LLM tracing. Promptfoo provides adversarial testing frameworks that simulate injection attempts before deployment.
A single harmful, off-brand, or misleading output in a public-facing product can cause reputational damage that far outweighs any efficiency gain the model delivers. Content safety monitoring is a risk management function.
Content safety monitoring tracks outputs across categories including:
Apple suspended its AI news summary feature in January 2025 after it produced misleading summaries and fabricated alerts. The resulting public backlash required a product rollback and drew significant media coverage. The outputs were wrong and went undetected long enough to cause real damage.
Air Canada faced a different version of the same problem. Its chatbot hallucinated a discount policy that did not exist. A customer relied on it, Air Canada tried to disclaim responsibility, and a court ruled against the airline. Responsible AI Labs reviewed this case alongside several similar incidents and reached a clear conclusion: these incidents were preventable with proper evaluation.
LLM-as-a-judge evaluation, where one model rates the outputs of another, is widely used because it scales. But it has limits. Research analyzed by Emergent Mind found that LLM-as-a-judge models align with subject-matter experts only 64 to 68% of the time in specialist domains like dietetics and mental health. For high-stakes or regulated applications, human review remains a necessary layer.
Compliance monitoring is no longer optional for teams deploying LLMs in regulated industries or selling to enterprise and government customers. The EU AI Act's GPAI transparency obligations took effect in August 2025. US federal procurement now requires model cards and evaluation artifacts under OMB M-26-04. Without audit trails, you cannot satisfy either requirement.
The EU AI Act, Regulation (EU) 2024/1689, requires providers of general-purpose AI models to maintain technical documentation, implement risk management processes, ensure data governance, and apply security measures. Penalties for non-compliance reach 7% of global annual turnover.
NIST's AI Risk Management Framework (AI RMF) provides a parallel structure for US-based organizations, emphasizing audit trails, bias documentation, and secure data handling across the model lifecycle.
For any organization that logs user inputs to improve model performance, GDPR and HIPAA introduce additional requirements around data-in-prompt handling, retention limits, and access controls.
Promptfoo's regulatory research team summarizes the shift in enterprise procurement: model behavior is now a contractual attribute, and procurement agencies want evidence you can measure and report on it.
A compliance-ready monitoring stack needs:
Helicone is built around proxy-first audit trail architecture. Langfuse provides open-source tracing with prompt versioning. Both integrate compliance-relevant logging without requiring a full platform migration.
"Enterprise clients ask about audit trails in the first conversation now. If you cannot show how your AI system logs decisions and flags failures, the deal stalls. It is that straightforward."
Brittany Charles, SVP, Client Services
Standard LLM observability measures model performance. It does not measure whether users accomplish anything. A model can score well on quality metrics while consistently failing to help users complete the tasks they came to do. Task completion rate, correction rate, and user churn correlated with LLM sessions are the outcome signals that connect model health to business results.
Task completion monitoring is not a single metric. It is a set of signals you instrument based on what your LLM is designed to do.
For a customer support chatbot:
For a content generation tool:
For a code assistant:
Outcome metrics feed back into quality monitoring. If your model scores well on automated quality metrics but task completion is declining, the quality metrics are measuring the wrong things. User behavior signals expose that gap and tell you which query types or user segments are underserved.
At Launchcodex, when we build AI automation systems for clients, we instrument task completion signals alongside model quality metrics from the start. The combination catches issues that neither layer surfaces alone.
A healthy base model does not guarantee a healthy pipeline. In RAG systems, failures happen in the retrieval layer before the model ever sees the query. In multi-agent systems, errors compound across agent calls in ways that no single-model monitor can detect. These architectures need their own monitoring layer.
RAG systems introduce failure modes that sit entirely outside the base model. The retrieval layer can fail by:
Groundedness monitoring checks whether the model's output is actually supported by the retrieved context. A model can produce a fluent, confident answer that has no connection to what was retrieved. Without groundedness scoring, that failure is invisible.
Multi-agent pipelines introduce a different class of problem. Each agent call adds latency, cost, and a potential failure point. Errors in early agent outputs compound through later steps. An agent that hallucinated a value in step two can cause a downstream agent to act on fabricated data.
Monitoring requirements for multi-agent systems include:
Galileo provides agent graph visualization for this. Arize covers RAG evaluation with groundedness scoring. Maxim AI supports deep agent simulation and evaluation at the pipeline level.
One practical test: run a set of known queries against your RAG system and verify that the retrieved documents actually support the expected answer. If they do not, the issue is in your retrieval configuration, not your model. Standard model monitoring will never surface this.
Every LLM production deployment needs coverage across six dimensions, not four. Here is how to structure that coverage without building everything at once.
| Dimension | Primary signal | Primary business risk |
|---|---|---|
| Accuracy and quality | Hallucination rate, groundedness, relevance | User trust, product reliability |
| Bias and drift | Output distribution shifts, demographic parity | Fairness, regulatory exposure |
| Cost and token efficiency | Cost per query, token ratio, cost by feature | Margin, unit economics |
| Latency and throughput | P95 latency, TTFT, requests per second | User retention, satisfaction |
| Security | Prompt injection attempts, output leakage, access logs | Data breach, liability |
| Compliance and audit trails | Log completeness, version tracking, evaluation artifacts | Regulatory penalties, enterprise sales |

Not every team needs to instrument all six dimensions on day one. Prioritize based on your deployment context.
The AI governance platform market is growing from $227 million in 2024 to a projected $4.83 billion by 2034, according to Knostic's governance platform analysis. That growth reflects a market moving from reactive monitoring to proactive governance. Teams that build complete monitoring infrastructure now are positioned to meet compliance requirements and enterprise procurement criteria that will only tighten.
NIST's AI RMF, OWASP's LLM Top 10, and the EU AI Act's GPAI requirements all point in the same direction. Monitoring is no longer a technical concern owned by ML engineers. It is a business function with regulatory and financial consequences attached to it.
Monitoring tracks specific metrics and fires alerts when thresholds are crossed. Observability is the broader practice of understanding system behavior through logs, traces, and metrics across all layers of the stack. For LLMs, observability includes prompt tracing, cost attribution, retrieval evaluation, and agent-level visibility that monitoring alone does not provide.
Prompt injection is an attack where adversarial input overrides your system-level instructions and changes how the model behaves. Detection requires input scanning that flags injection patterns before the model processes them, combined with output monitoring that catches unexpected behaviors after the fact. Tools like Datadog LLM Observability and Promptfoo include injection detection as a built-in feature.
If your company provides a general-purpose AI model, deploys a high-risk AI system, or offers AI-powered products to users in the EU, the EU AI Act likely applies. GPAI transparency obligations took effect in August 2025. Consult legal counsel for jurisdiction-specific guidance. The GPAI category carries penalties up to 7% of global annual turnover for non-compliance.
Groundedness measures whether a model's output is actually supported by the documents it retrieved. A model can produce a confident, fluent answer that has no connection to the retrieved context. Groundedness scoring flags those cases. It is a critical metric for any RAG system where factual accuracy matters.
Cost attribution at the feature or team level requires a consistent tagging strategy at the API call level. Every request should include metadata tags identifying the originating feature, team, or user segment. Tools like Traceloop and Helicone support per-user and per-feature cost attribution with minimal setup. Without tagging, you can only see total spend, not where it comes from.
LLM-as-a-judge uses one language model to evaluate the outputs of another. It scales well and requires no human labeling pipeline. But research shows it aligns with subject-matter experts only 64 to 68% of the time in specialist domains. For applications in healthcare, legal, finance, or other expert-dependent fields, automated scoring needs to be paired with human review for high-stakes outputs.


AI Mode, search agents, and Personal Intelligence just changed at Google I/O 2026. Here is the data on what it means for you...
Learn how multi-source content verification reduces AI hallucination risk and builds content that earns trust and ranks in A...
Performance creative is the data-driven approach to building ads that convert. Learn what it is, which metrics matter, and h...