
Share:

AI marketing & automation


Your ad platform, your analytics tool, and your CRM can each name a different channel as the reason a customer bought from you. All three can be technically correct, because each one runs its own attribution model against its own slice of the data. Meta credits its own ads. Google Analytics credits a session source. A CRM credits whatever contact record it can see. None of them is lying. They are answering different questions.
This guide compares the core marketing attribution models side by side, shows what Google Analytics 4 and HubSpot actually support right now, and gives you a framework for matching a model to your sales cycle and data maturity. It also covers why attribution alone cannot prove a channel caused a sale, and what to check before you trust the number sitting on your dashboard.
A marketing attribution model is a rule, or a set of rules, that assigns credit for a conversion to the touchpoints a customer interacted with before buying. Platforms disagree because each one applies its own rule to its own visibility into the journey. As AdStellar founder Matt Pattoli puts it, treat every attribution number as a model output, not a neutral description of reality.
A model is a lens, not a fact. Change the lens and the same customer journey produces a different winner.
Every model on the market falls into one of two categories.
Single touch is simple and fast to read. Multi touch is more realistic for any journey with more than two or three touchpoints, which describes most B2B and considered purchase decisions today.
Last click remains the default in most reporting tools because it requires no setup and produces one clean number. The risk is that it rewards whichever channel happened to be present at the final moment, even when it did none of the work that built the buyer’s intent.
This gap between confidence and practice shows up in Nielsen’s 2025 Annual Marketing Report, which found that 85 percent of marketers feel confident in their ability to measure holistic ROI, yet only 32 percent actually measure it across digital and traditional channels together, a figure that falls to 23 percent in Europe. Forrester analyst Ross Graber has warned plainly that trust in marketing measurement is already poor, and it’s poised to get worse.
“Every client conversation about attribution starts the same way. Leadership trusts the dashboard until we show them what last click is hiding upstream.” Tanner Medina, Co-Founder and Chief Growth Officer
The six models marketers compare most often are first touch, last touch, linear, time decay, position based, and data driven attribution. Each one assigns credit differently, which means each one points your budget toward a different channel even when it examines the exact same customer path.
First touch gives full credit to the interaction that started the journey, which is useful for judging which channels create new demand. Last touch gives full credit to the final interaction, which is useful for judging what closes deals. Neither one tells you anything about what happened in between.
Linear splits credit equally across every touchpoint. Time decay weights recent touchpoints more heavily, which fits short consideration windows and promotional pushes. Position based, sometimes called U shaped, gives the heaviest credit to the first and last touch and splits the remainder across the middle. All three are rule based, meaning the weighting is fixed in advance rather than learned from your actual data.
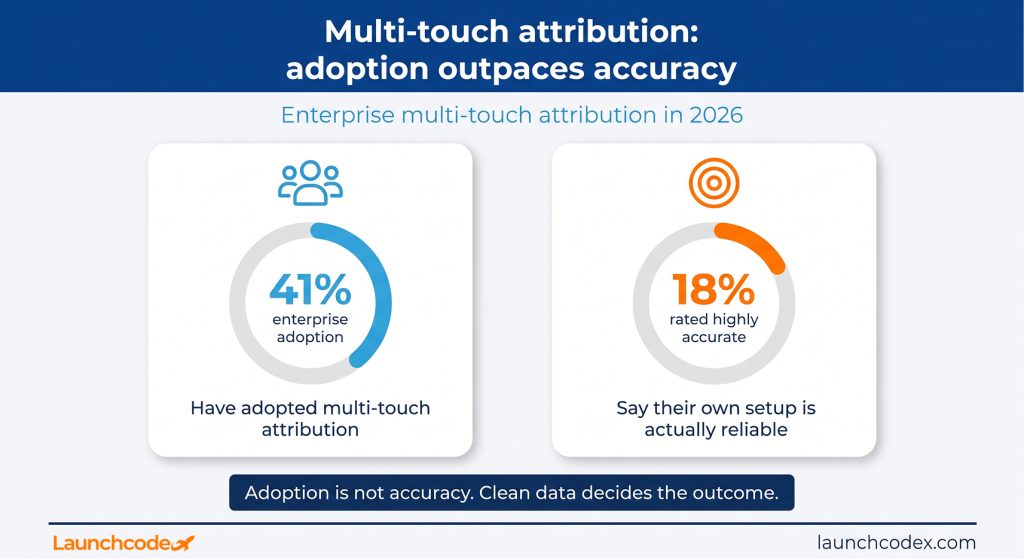
Data driven attribution uses machine learning to assign credit based on each touchpoint’s measured contribution to conversion, rather than a fixed rule. It requires real volume and clean, connected data to work well. Enterprise adoption of multi touch attribution has reached 41 percent, but only 18 percent of those implementations are rated as highly accurate by the teams running them, according to Digital Applied’s 2026 marketing analytics research. Sophistication without clean data does not produce accuracy on its own.
“A data driven model is only as good as the pipeline feeding it. We won’t recommend one until a client’s tracking can actually deliver clean, connected data across channels.” Derick Do, Co-Founder and Chief Product Officer
| Model | Credit logic | Best for | Data requirement |
|---|---|---|---|
| First touch | 100 percent to the first interaction | Measuring what creates awareness | Minimal |
| Last touch | 100 percent to the final interaction | Short, simple sales cycles | Minimal |
| Linear | Equal credit across every touchpoint | A balanced baseline view | Moderate |
| Time decay | More credit closer to conversion | Recency driven, promotional journeys | Moderate |
| Position based | Heavy credit to first and last touch | Balancing discovery and closing | Moderate to high |
| Data driven | Credit weighted by measured contribution | High volume, clean, connected data | High |
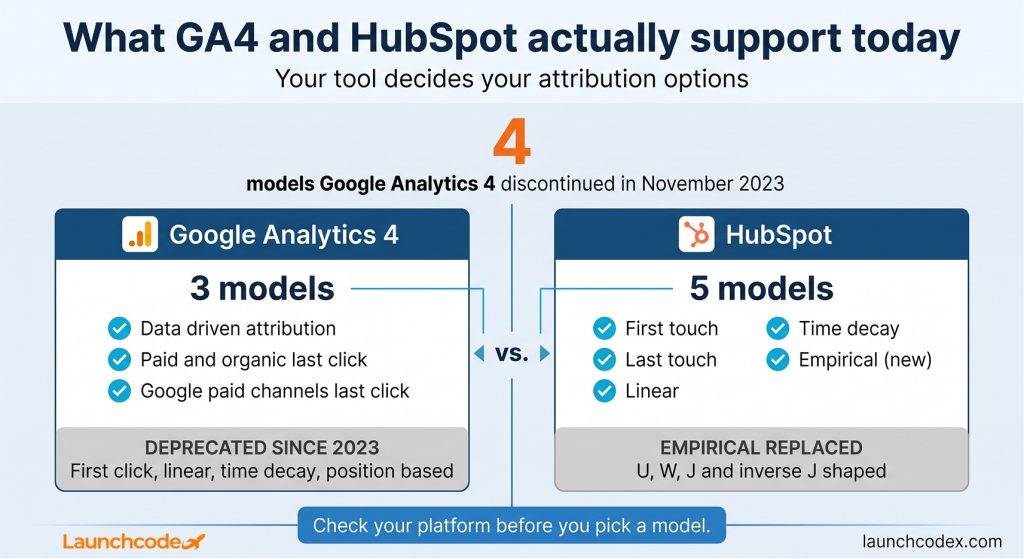
Google Analytics 4 only offers three attribution models as of November 2023, data driven attribution, paid and organic last click, and Google paid channels last click. First click, linear, time decay, and position based models were all deprecated. HubSpot still supports five models, first touch, last touch, linear, time decay, and a newer empirical model, so the tool you already own decides which of the models above are even available to you.
Plenty of older guides still describe GA4 offering linear or position based attribution as a dropdown option. That guidance is stale. Google’s own Analytics Help Center confirms only the three current models remain, which means any team still comparing rule based models inside GA4 is looking at a menu that no longer exists.
HubSpot’s report builder still supports first touch, last touch, linear, and time decay, and it added an empirical model that assigns credit based on how often each interaction type appears across real conversion paths, according to HubSpot’s own knowledge base. That empirical model replaced the older U shaped, W shaped, J shaped, and inverse J shaped options, so advice built around those older names needs an update.
Once your team needs true data driven attribution, a native tool is usually not the answer. Platforms built specifically for this, including Dreamdata, Cometly, Northbeam, CaliberMind, 6sense, and Windsor.ai, exist because GA4 and HubSpot were never designed to model machine learning based credit across every channel, CRM stage, and offline touchpoint at once.
“GA4 and HubSpot were built to report on marketing, not to model attribution across a CRM and six ad platforms at once. That gap is why dedicated platforms exist.” Derick Do, Co-Founder and Chief Product Officer
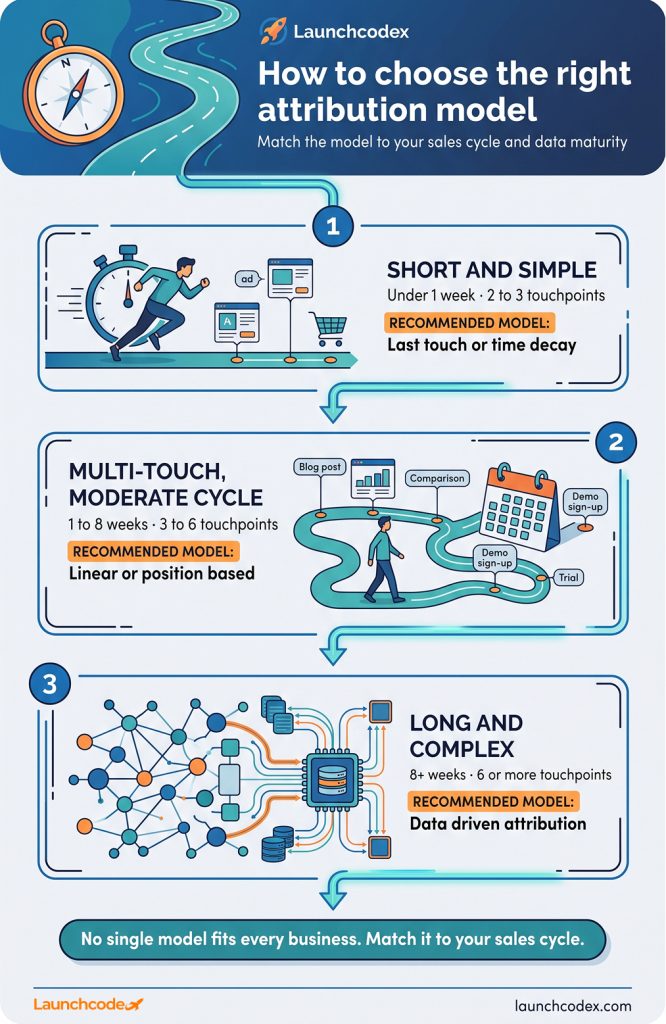
Match your model to three things, sales cycle length and touchpoint volume, data maturity, and whether you need marketing mix modeling alongside it. There is no universally correct model, only the model that fits what your business can actually measure and defend.
A sophisticated model without clean data produces false confidence, not better decisions. If your tracking has gaps across devices or channels, a simpler model applied consistently will serve you better than a complex model you cannot fully trust. Build up to complexity as your tracking coverage improves, rather than the other way around.
“We would rather run a clean linear model a client actually trusts than a data driven model built on tracking gaps nobody has fixed yet.” Tanner Medina, Co-Founder and Chief Growth Officer
Marketing mix modeling has become the top measurement investment category among marketers in 2026, at 40 percent, ahead of data driven attribution investment at 35 percent, according to SQ Magazine’s Marketing Measurement Trends report. Gartner’s analysis, cited in the same Digital Applied dataset referenced earlier, found that organizations combining multi touch attribution, marketing mix modeling, and AI based analysis outperform single method organizations by about 40 percent on marketing efficiency. Attribution answers what closed the deal. MMM answers what the total channel mix contributed, including offline and brand effects attribution cannot see.
One pitfall worth naming here. impact.com’s Global State of Affiliate Marketing 2025 report found that 94 percent of brands are exploring alternative attribution models, yet only 20 percent track customer acquisition cost and 18 percent track average order value by individual partner or channel. A technically correct model still rewards the wrong channel if you never layer in what each channel actually costs to acquire.
Attribution assigns credit. Incrementality measures whether the conversion would have happened without the marketing at all. As longtime Google analytics evangelist Avinash Kaushik has put it, attribution and incrementality are not the same thing, chalk and cheese. A model can be technically sophisticated and still tell you nothing about causation.
A holdout test withholds a marketing exposure from a control group and compares outcomes against an exposed group. The gap between the two groups is the actual lift, separate from whatever your attribution model already credited that channel. Retargeting and branded search tend to look strongest under last click and weakest under a holdout test, because both often reach people who were already going to convert.
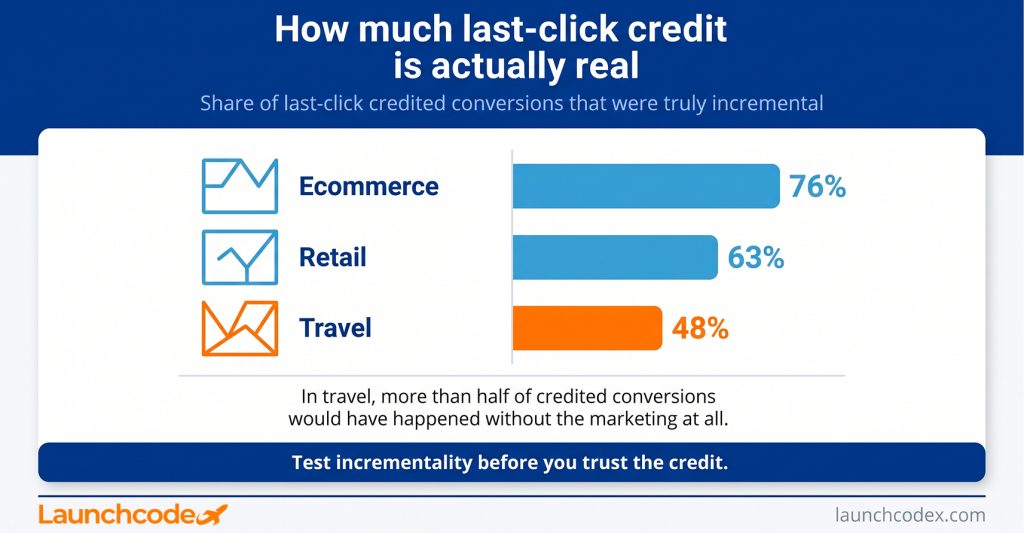
Research from Nico Neumann, Associate Professor of Marketing at Melbourne Business School, found that last click attribution matched the budget decision a real experiment would have produced in about 84 percent of cases, while model based predicted incrementality reached about 90 percent. The share of last click credited conversions that were truly incremental ranged from roughly 76 percent in ecommerce down to about 48 percent in travel. A model that works well in one industry can mislead you badly in another, which is why a quick holdout test on your top channel is worth running before you commit budget to any single model’s verdict.
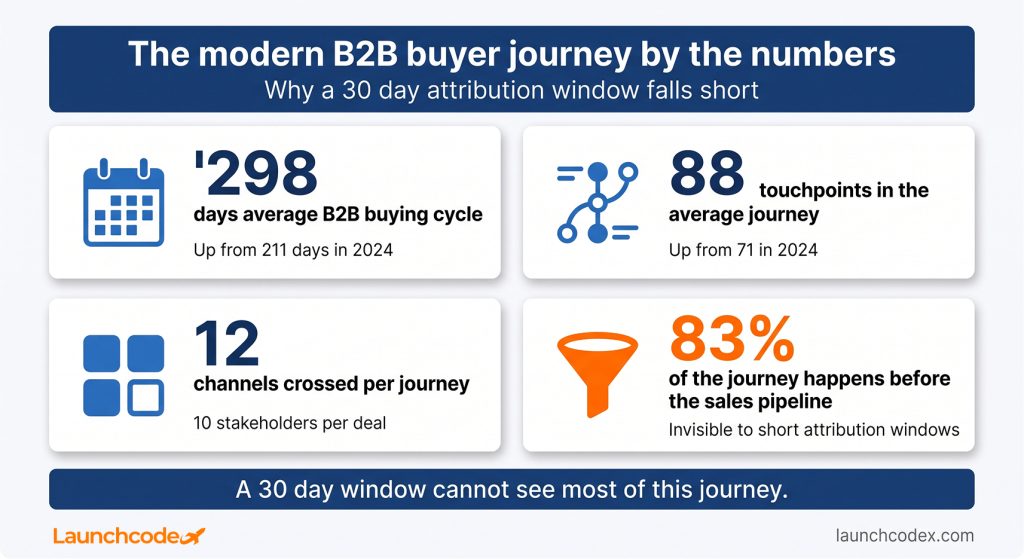
Standard 30 or 90 day attribution windows were built for a shorter buying process than most B2B companies now face. The average B2B buyer journey spans 272 days and 88 touchpoints across four channels, and 81 percent of that journey happens before the buyer ever enters a formal sales pipeline, according to Dreamdata’s 2026 benchmark research. A short window cannot see most of that.
Extending your measurement horizon changes the apparent value of upper funnel work. Cross channel marketing ROI averages 1.87 pounds per pound spent when measured short term, rising to 4.11 pounds per pound, a 120 percent increase, once long term effects are counted, based on WARC and Google’s Global Compass benchmark data. Sixty percent of marketers say they struggle to measure cross channel impact at all, and 63 percent struggle to measure activity between funnel stages, according to Demand Gen Report’s attribution survey. If your window ends before your buyer’s research does, your model is measuring a fraction of the journey and reporting it as the whole thing.
Third party cookie deprecation and Apple’s App Tracking Transparency framework have already reduced how much of a cross device journey any tool can see directly. Layered on top of that, buyers increasingly research through ChatGPT, Perplexity, and Google’s AI Mode before a single trackable click occurs, a phase some analysts now call the dark funnel. No attribution model currently gives full visibility into that research phase, and any tool claiming otherwise deserves a skeptical look before you rely on it for budget decisions.
Most teams inherit their attribution model from whatever their ad platform or CRM defaults to, then never revisit it. That is the actual problem this article set out to fix. Name your sales cycle length and current data maturity honestly, check what your existing GA4 and HubSpot setup can actually run today, and pick the simplest model that fits both. Then run one holdout test on your largest channel before you shift meaningful budget based on the result.
When Launchcodex audits a client’s reporting stack, this tool aware sequence, matching the model to what the business and its data can actually support, is usually what separates a defensible attribution setup from a dashboard nobody trusts.
If your current setup still assumes GA4 offers linear or position based attribution, or still leans on HubSpot’s old U shaped model, fix that before anything else on this list.
There is no single best model. Short B2B cycles with few touchpoints can start with last touch or time decay. Longer cycles with six or more touchpoints usually need position based or data driven attribution, paired with marketing mix modeling once budgets get large enough to justify it.
No. GA4 removed first click, linear, time decay, and position based attribution in November 2023. Only data driven attribution, paid and organic last click, and Google paid channels last click remain.
Attribution assigns credit for a conversion across touchpoints. Incrementality measures whether that conversion would have happened without the marketing at all, usually through a holdout or experiment. A channel can win under attribution and still show weak incrementality.
Once a typical customer interacts with three or more channels before converting, last touch starts hiding real influence from your upper funnel. That is a reasonable point to move toward linear, position based, or data driven attribution.
Often yes. Attribution tracks individual, trackable touchpoints. Marketing mix modeling estimates aggregate channel contribution, including offline and brand effects that user level tracking cannot see. Many mature teams run both and reconcile the two rather than picking one.


Real stories from the people we’ve partnered with to modernize and grow their marketing.