

Share:

AI marketing & automation


Most teams can see conversion sliding in a dashboard but cannot say which stage is bleeding or why. They react to the scariest number, redesign the wrong page, and watch the total barely move. The problem is not effort. The problem is aim.
This guide gives you a repeatable method to find your biggest money leak, diagnose its true cause, and fix it in the order that returns the most revenue. You get a prioritization formula, a cause-to-fix table, and the benchmarks to judge whether a stage is actually broken.
Your biggest drop-off is the stage that loses the most users, not the one with the highest drop rate. Multiply each step’s drop percentage by the number of people who enter it. A moderate drop on a high-traffic early step usually wastes more revenue than a severe drop near the end. Rank every stage by lost volume first, then act.
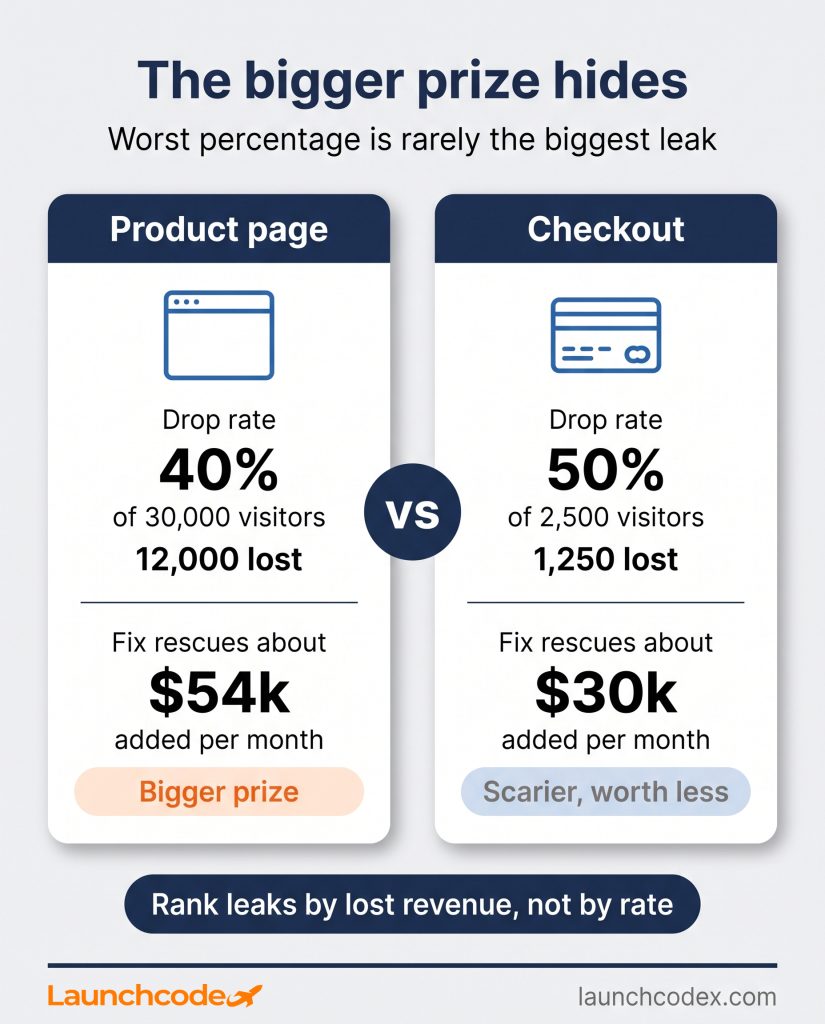
Percentages hide scale. A 50 percent drop at a payment step that only 2,500 people reach looks urgent. A 40 percent drop at a product page that 30,000 people reach is quieter but far more expensive.
Use one calculation to rank opportunity: drop rate multiplied by entering traffic, weighted by what a rescued user is worth downstream.
Picture an ecommerce funnel. The product page loses 40 percent of 30,000 visitors, so 12,000 leave. Checkout loses 50 percent of 2,500 visitors, so 1,250 leave. Cutting the product page drop to 35 percent rescues 1,500 users. At a 30 percent path to purchase and a 120 dollar order value, that adds about 54,000 dollars a month. Cutting the checkout drop to 40 percent adds roughly 30,000 dollars. The quieter stage held more recoverable revenue.
“We rank every leak by dollars before touching a page. A 40 percent product page drop on 30,000 visitors beats a scary 60 percent checkout drop on 2,000 almost every time.” Tanner Medina, Co-Founder and Chief Growth Officer.
Define your funnel as four to seven ordered, trackable events before you measure anything. Then pull stage-to-stage rates and split them by device, source, and user type. A blended number averages away the problem. A 30 percent checkout drop can be 15 percent on desktop, and 55 percent on mobile, and only the segmented view tells you where to look.
Aggregate data is a starting point, never an answer. As the Quantum Metric analytics team puts it, drop-off looks identical in the data no matter what caused it, so you have to look closer before you conclude anything.
Reliable measurement is the foundation. Launchcodex treats this data infrastructure work as a prerequisite, because optimizing on broken tracking just moves guesses around faster.
“On most audits we run, the funnel looks broken until we check the tracking. Half the time a GA4 event fires twice, so the drop is measurement noise, not user behavior.” Derick Do, Co-Founder and Chief Product Officer.
Watch mobile closely. Baymard Institute data reported by Zipchat shows mobile abandonment runs about 15 percentage points higher than desktop, and that gap has not closed.
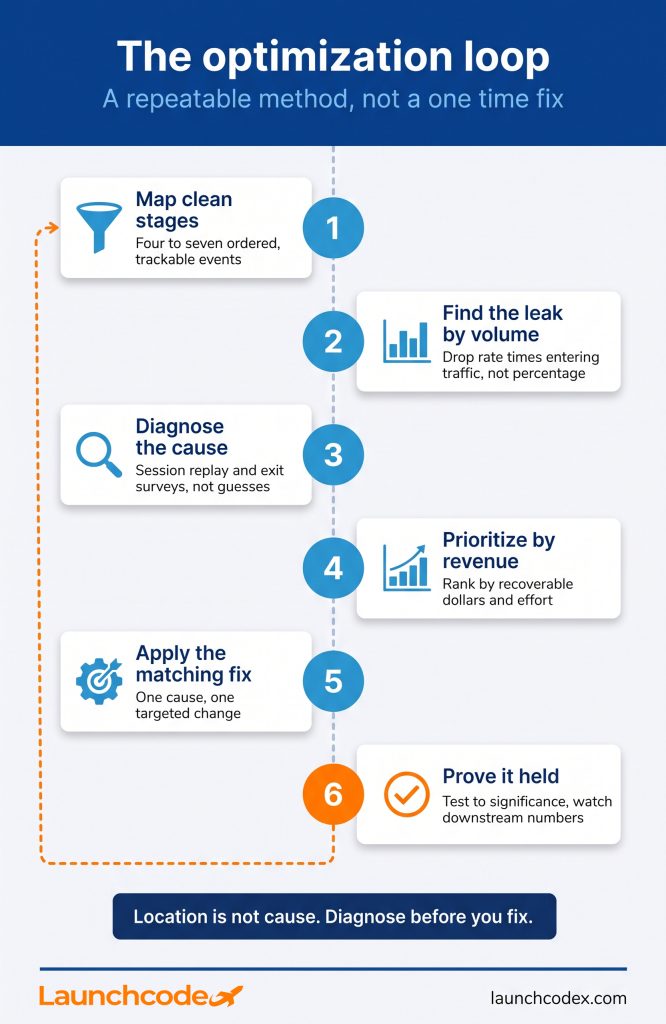
Knowing where users leave does not tell you why. UX friction, cost shock, weak value, missing trust, and technical faults all produce the same drop in a chart, yet each needs a different fix. Pair the drop-off number with session replay and exit surveys to confirm the cause before you change anything.
This is the step most teams skip, and it is why redesigns so often fail. Fixing the wrong cause produces no lift and makes the team doubt the whole program.
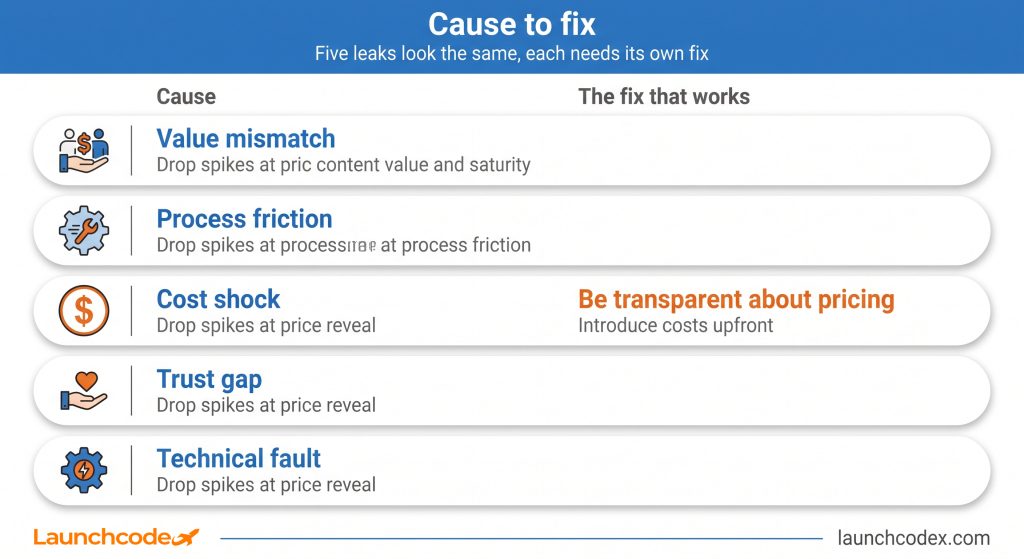
| Cause type | What the data shows | How to confirm it | The fix that works |
|---|---|---|---|
| Value mismatch | High exit on entry pages, low time on page | Message match review, exit survey | Align ad and page message, sharpen the offer |
| Process friction | Drop grows with each step or form field | Session replay, form analytics | Cut fields, add guest checkout, show progress |
| Cost shock | Drop spikes at the shipping or price reveal | Step timing, exit survey | Show full cost early, remove surprise fees |
| Trust gap | Drop concentrates at payment for new users | Replay, new versus returning segment | Add proof and security signals at commitment |
| Technical fault | Drop isolated to one browser or device | Cross-device segment, replay | Fix the bug, retest across devices |
Reframe abandonment as hesitation, not disinterest. Rashel Hariri, CMO at Foursixty, argues that cart abandonment reflects unresolved hesitation rather than a lack of intent. One unanswered question at the wrong moment can undo everything the funnel did right before it.
“Session replay changes the argument in the room. When the team watches ten users fail the same form field, the fix stops being an opinion and becomes obvious.” Derick Do, Co-Founder and Chief Product Officer.
Rank fixes by recoverable revenue and ease of implementation, not by how alarming the percentage looks. Score each opportunity on likely lift and effort, then start where a real win is most probable at a high-value step. Fixing the right stage beats improving five stages by a point each.
Guesswork does not scale. Peep Laja, founder of CXL Institute, notes that testing random ideas one at a time could take years, so research has to tell you the specific problem first. His rule for sequencing is direct: follow the money.
The repeat offenders are surprise costs, bloated forms, forced account creation, slow pages, and thin trust signals. Each has a proven, measurable fix. Surface total cost early, cut form fields, offer guest checkout, speed up the page, and place proof at the point of commitment.
These patterns show up across ecommerce and lead generation. The good news is that most are design problems, which means you can fix them without new features.
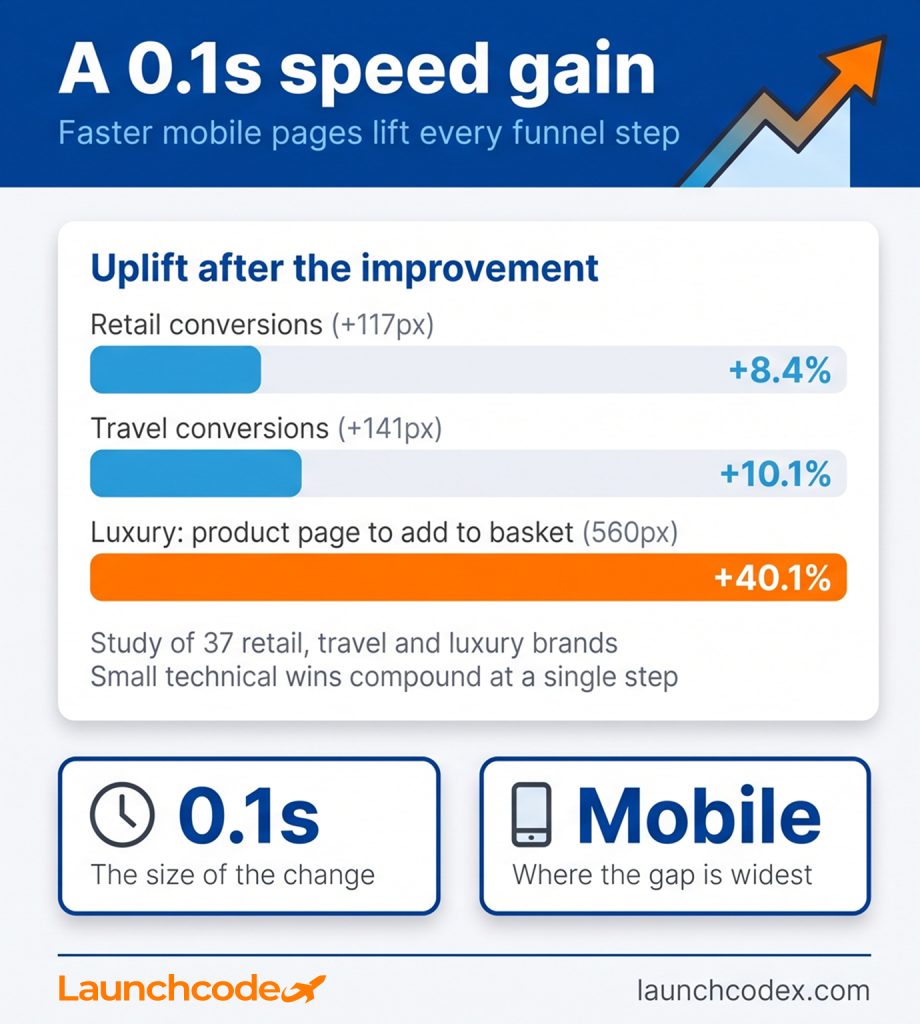
Late stage intent should be high. Peep Laja points out that people who reach a pricing page should convert at 70 to 90 percent, so a low rate there signals a clear leak. For earlier stages, VWO benchmark data shows Lead to MQL at 25 to 35 percent and MQL to SQL at 13 to 26 percent. The stage furthest below its benchmark is where you start.
Confirm a fix with a controlled test and watch the downstream numbers, not just the stage you changed. A change can lift one step while pulling in low-intent users who churn later. Run the test to statistical significance, usually about four weeks on average traffic, then verify the win held across the full funnel.
A stage-level win means nothing if it drags revenue down elsewhere. Always pair drop-off analysis with retention or purchase quality so you are measuring real gains.
This discipline is why only 39.6 percent of companies run a documented CRO strategy, yet those using structured tools report an average return near 223 percent. A written method is what separates repeatable gains from lucky ones.
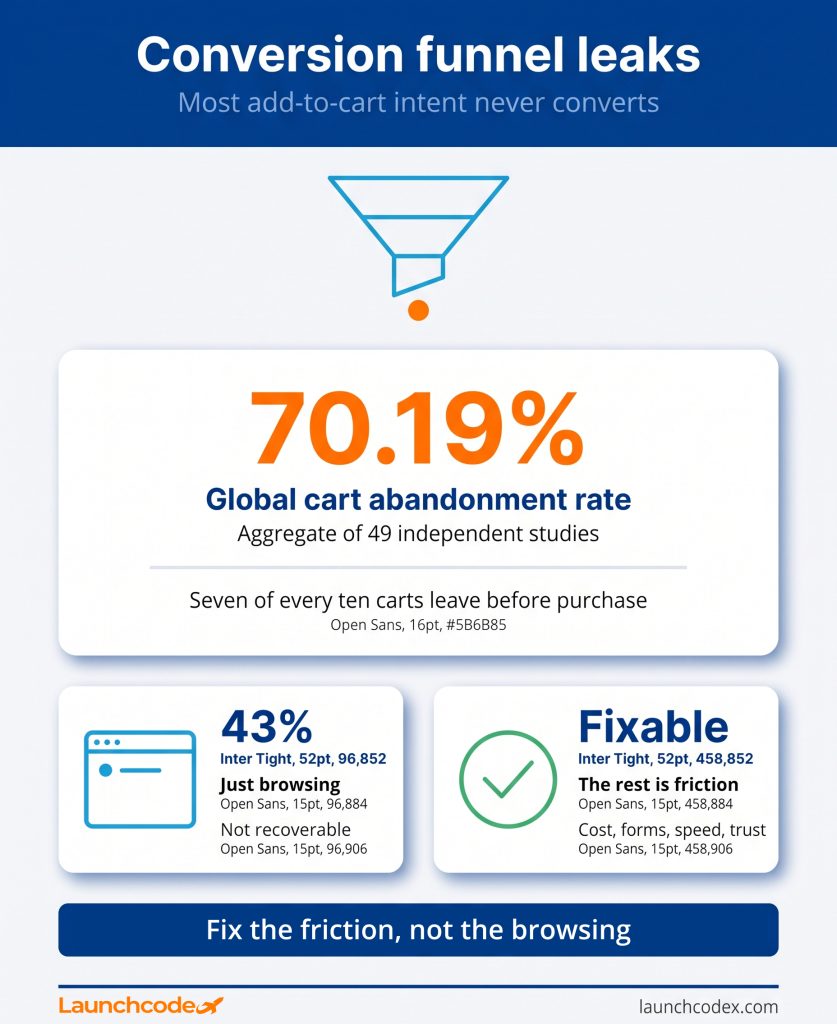
Funnel optimization is not a redesign or a checklist of tips. It is a loop. Map clean stages, find the leak by lost volume, diagnose the real cause with replay and surveys, prioritize by recoverable revenue, apply the matching fix, and prove it held. Remember that a share of abandonment is normal browsing and cannot be recovered, so aim your effort at friction you can actually remove.
Your next step is small. Pull your stage-to-stage rates, multiply each drop by its entering traffic, and rank the results by dollars. That single ranked list tells you where to start, and it almost always points somewhere other than the number that scared you.
There is no universal number. The cross-industry average sits near 2.9 percent, but judge yourself stage by stage against your own segment. A weak overall rate is often one broken stage, not a funnel-wide problem.
Map your funnel into ordered events, pull the drop rate for each transition, then multiply each rate by the traffic entering that step. Rank by users lost, not by percentage. Segment by device and source before you conclude.
The leading causes are unexpected costs shown too late, too many form fields, forced account creation, and slow or buggy pages. Most are design issues you can fix. Baymard research shows better checkout design can lift conversion by up to 35 percent.
Run a controlled test to statistical significance, which on average traffic takes around four weeks. Then track the changed step for two to four more weeks and confirm downstream conversion and retention held before moving on.


Real stories from the people we’ve partnered with to modernize and grow their marketing.