
Share:

AI marketing & automation


Roughly half the websites on the internet fail Google’s Core Web Vitals assessment. That means slower pages, more visitors leaving before they convert, weaker rankings, and a measurable hit to revenue. The teams that close this gap see better Search Console numbers and real gains in sales, leads, and organic traffic.
This guide covers what every marketing manager, SEO lead, and business owner needs to know: what each metric measures, what scores to hit, how to read the right data, how to fix each metric, and how to build a monitoring program that holds up as your site changes over time.
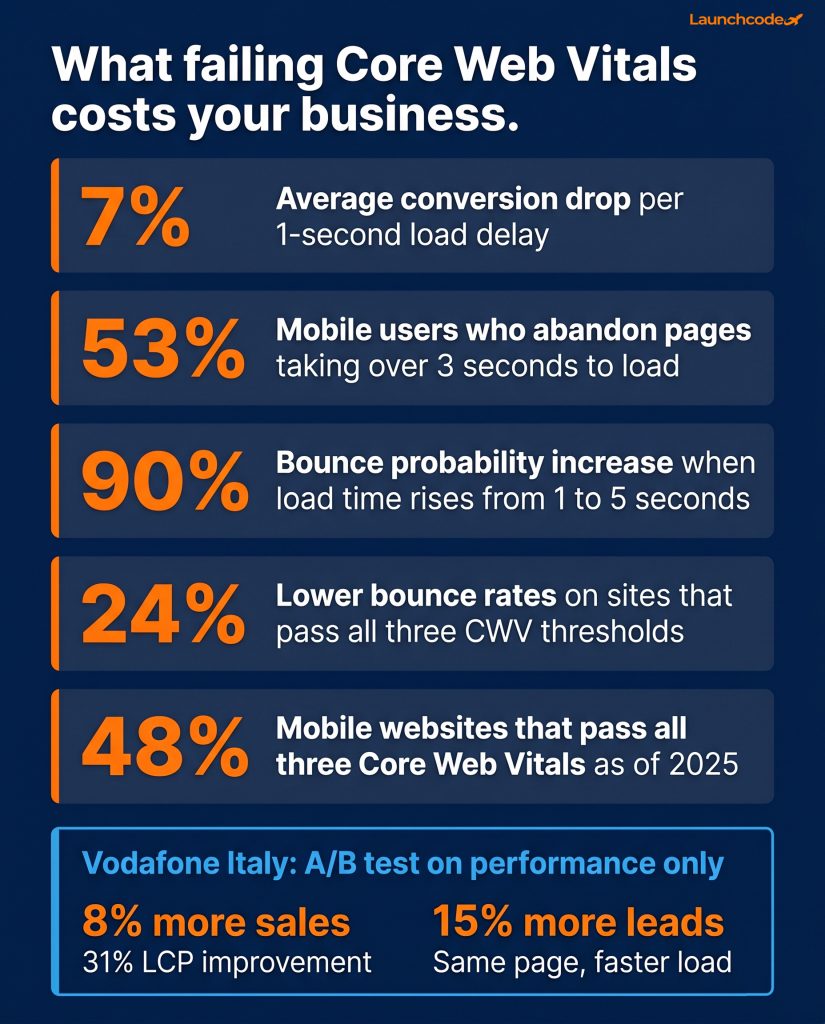
Core Web Vitals are a revenue problem, not a technical checkbox. Every 1-second delay in load time reduces conversions by 7% on average. When 53% of mobile users abandon pages that take more than 3 seconds to load, the business case for fixing these metrics becomes clear. Controlled tests from major brands confirm the connection: better performance drives measurable gains in sales and leads.
Google has published case studies that put exact numbers on this. Vodafone Italy ran an A/B test on two visually identical pages where the only variable was page performance. The optimized page, with a 31% better LCP score, generated 8% more sales, a 15% improvement in lead-to-visit rate, and an 11% improvement in cart-to-visit rate. No visual changes. No content changes. Speed alone drove every outcome.
Rakuten 24 saw even sharper results. After A/B testing focused on Core Web Vitals, the team found that good LCP scores correlated with a 53.37% increase in revenue per visitor and a 33.13% increase in conversion rate compared to the control group. Both companies isolated performance as the only variable, which rules out confounding factors.
Industry benchmarks reinforce this at scale. When mobile page load time increases from 1 to 5 seconds, the probability of a mobile user bouncing rises by 90%. Sites that pass all three Core Web Vitals thresholds see 24% lower bounce rates compared to sites that fail. These patterns appear consistently across retail, B2B, media, and service industries.
“The revenue case for Core Web Vitals surfaces quickly in client conversations when you show them the Vodafone numbers. A 31% LCP improvement driving 8% more sales is the kind of data that gets budget approved fast.” – Tanner Medina, Co-Founder & CGO
Google confirmed Core Web Vitals as a ranking signal in June 2021 as part of the page experience update. They work as tiebreakers. When two pages have similar content quality, authority, and relevance, the one with better Core Web Vitals scores tends to rank higher. In competitive search categories, the gap between position 3 and position 8 frequently comes down to page experience signals. That gap captures roughly three times the click volume on most queries, which translates directly to traffic and pipeline.
As of 2025, only 48% of mobile websites and 56% of desktop websites pass all three Core Web Vitals thresholds, according to the HTTP Archive Web Almanac. Improving your scores puts you ahead of more than half the web on mobile.
AI-powered search platforms evaluate page quality when selecting content for overviews and generated answers. Technical performance is part of that quality signal. Pages that fail Core Web Vitals tend to surface less frequently in AI search results. Optimizing for CWV supports traditional organic rankings and visibility in generative and AI-assisted search.
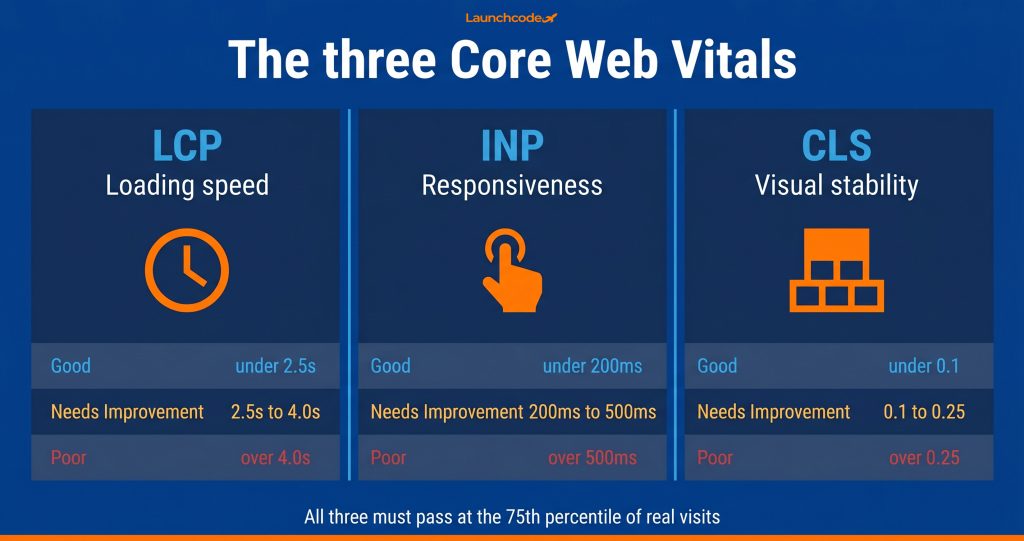
The three Core Web Vitals are Largest Contentful Paint (LCP) for loading speed, Interaction to Next Paint (INP) for responsiveness, and Cumulative Layout Shift (CLS) for visual stability. Google scores all three using real Chrome user data at the 75th percentile. A page passes its Core Web Vitals assessment only when 75% of real visits meet the good threshold across all three metrics simultaneously.
The 75th percentile matters because it reflects what most of your visitors actually experience. Google chose it to avoid situations where a small number of slow sessions drag down an otherwise fast site, while still ensuring performance is reliably good for the majority of visitors.
Here are the current thresholds:
| Metric | What it measures | Good | Needs improvement | Poor |
|---|---|---|---|---|
| LCP | Loading performance | Under 2.5s | 2.5s to 4.0s | Over 4.0s |
| INP | Interaction responsiveness | Under 200ms | 200ms to 500ms | Over 500ms |
| CLS | Visual stability | Under 0.1 | 0.1 to 0.25 | Over 0.25 |
These thresholds reflect what is achievable for real sites while capturing the performance gaps users actually notice. The metrics have evolved since Core Web Vitals launched in 2021 and may change again as measurement methods improve and the web raises its performance baseline.
LCP marks the moment the largest visible content element finishes rendering. In practice, this is almost always the hero image, a large heading, or a video poster above the fold. It answers the question every visitor asks the moment a page starts loading: is this working?
LCP is the hardest of the three metrics to pass. According to the 2025 Web Almanac, only 62% of mobile pages achieve a good LCP score. The most common causes are slow server response times, hero images in oversized or inefficient formats, and render-blocking scripts that force the browser to wait before painting any content.
A significant share of sites still lazy load their LCP image, which directly causes slow scores. Lazy loading defers image fetching until the element enters the viewport. That is the right approach for below-the-fold images, but it delays the browser from fetching the most important asset on the page.
INP replaced First Input Delay (FID) in March 2024. FID only measured the delay of the very first user interaction. INP measures how fast the page responds to every interaction throughout the session, from the first click to every tap, menu open, and keystroke, returning the slowest response as the score.
A good INP score is under 200 milliseconds. Currently, 43% of sites fail this threshold, making it the most commonly failed Core Web Vital. The primary cause is JavaScript running on the browser’s main thread and blocking it from responding to user input until the script finishes.
INP is the most technically demanding of the three metrics to fix. It requires JavaScript profiling, task optimization, and sometimes architectural changes to how a site renders and responds to interactions.
CLS measures how much visible page content shifts unexpectedly during and after load. Each layout shift gets a score based on the proportion of the viewport that moved and the distance it traveled. Scores accumulate across the full page session.
Common causes include images and ads without explicit dimensions, web fonts that load late and cause text to reflow, and content dynamically inserted above existing text after the page starts rendering. CLS has the highest pass rate of the three metrics. Around 79% of mobile pages achieve a good score. The remaining failures are concentrated on pages with ad slots and dynamic content.
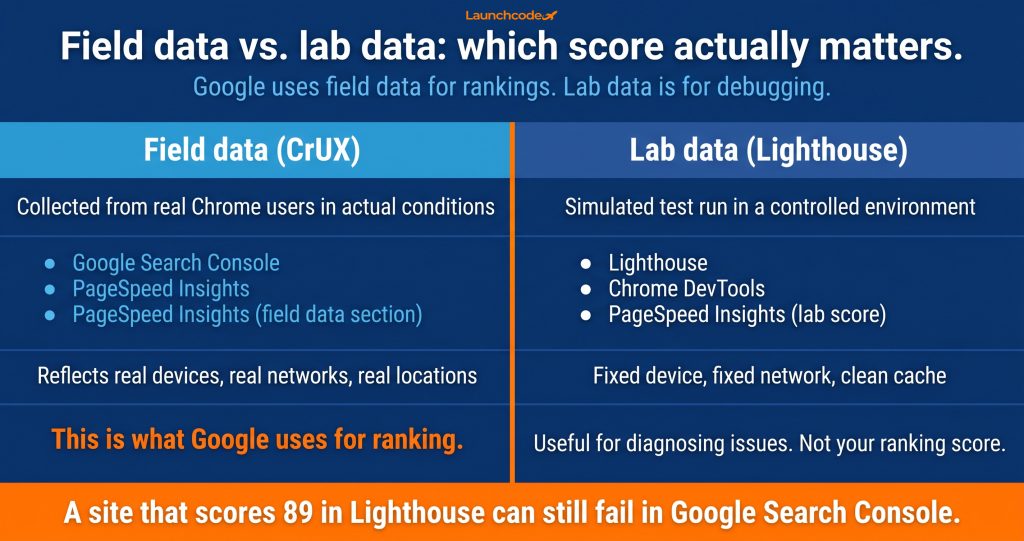
Google ranks your site using field data collected from real Chrome users, stored in the Chrome User Experience Report (CrUX). Lab data from tools like Lighthouse runs under controlled, simulated conditions and does not reflect real-user behavior. If you optimize for your Lighthouse score without checking field data, you may be fixing the wrong things and missing the actual cause of your CWV failures.
Arjen Karel, Core Web Vitals consultant and creator of corewebvitals.io, states it directly: “Field data and lab data measure different things. Confuse them and you will optimize for the wrong numbers.”
Lab tests run under fixed conditions: a defined simulated device, a specific network speed, a clean browser cache. Real users visit from older phones, variable network speeds, different geographic locations, and with browser states that behave differently. LCP is particularly sensitive to these differences. A hero image that loads in 1.8 seconds in a Lighthouse simulation may load in 4 seconds for a mobile user on a congested connection in a different city.
Google Search Console shows only field data, grouped into URL clusters across the site. PageSpeed Insights shows both: field data from CrUX at the top of the report when available, and lab data from Lighthouse below it. The field data section in PageSpeed Insights is the number that reflects your ranking assessment. The Lighthouse score is a diagnostic tool, not a scorecard.
“We see this mismatch constantly during audits. A site scores 89 in Lighthouse and the team is confused about why Search Console shows failing CWV. Field data tells a different story than a simulated test, and that gap is where the real fix lives.” – Derick Do, Co-Founder & CPO
New pages and low-traffic URLs often lack enough Chrome user data to generate a CrUX score. In these cases, Google may fall back to URL group-level or origin-level data. For new sites or recently launched pages, use PageSpeed Insights lab data as a starting point for optimization, but track when field data becomes available in Search Console and shift to that as your primary reference.
Start in Google Search Console. Go to Experience, then Core Web Vitals. Review which URL groups are marked Poor, then take those specific URLs into PageSpeed Insights to see field data and get diagnostic recommendations for each failing metric. This two-step process covers site-wide status first and page-level diagnosis second.
Here is how the main measurement tools compare:
| Tool | Data type | Best used for |
|---|---|---|
| Google Search Console | Field data (CrUX) | Site-wide CWV status, grouped by URL pattern |
| PageSpeed Insights | Field data and lab data | URL-level diagnosis, Lighthouse audit |
| Chrome DevTools | Lab data | Real-time performance profiling and debugging |
| DebugBear | Field data, lab data, real user monitoring | Continuous monitoring, competitor benchmarking |
| Screaming Frog with PSI API | Field data and lab data via export | Site-wide CWV audit at scale across all URLs |
LCP improves when the browser can find, fetch, and render the largest content element faster. Four areas drive most of the gains: reduce server response time, remove what blocks the browser from starting to render, tell the browser to prioritize the LCP resource, and compress the asset itself. Fix them in that order, working from the server outward to the asset.
Most LCP failures trace back to three root causes: a slow server, an unoptimized or misprioritized image, or a render-blocking script that delays all rendering.
Time to First Byte (TTFB) is the time for the first byte of the HTML document to reach the browser. TTFB above 600ms makes it extremely difficult to achieve a good LCP score. The target is under 200ms.
The fastest way to reduce TTFB is a CDN (content delivery network) that serves your site from edge locations close to the user. Server-side page caching and switching from shared hosting to a server with dedicated resources also reduce TTFB substantially. For WordPress sites, moving from shared hosting to a server with full-page caching enabled can drop TTFB from over 1 second to under 300ms.
Render-blocking resources force the browser to wait before it can paint any content. These are typically CSS files and JavaScript that load in the HTML head without async or defer attributes.
Add fetchpriority=”high” to the LCP image element. This attribute tells the browser to request this resource ahead of other assets in the loading waterfall. It is one of the highest-impact single-line changes available for improving LCP scores.
Remove loading=”lazy” from any image that appears above the fold. Lazy loading is the right approach for below-fold images, but applying it to the hero image tells the browser to delay fetching the most important asset on the page.
Convert hero images and featured images to WebP or AVIF format. These modern formats are significantly smaller than JPEG at equivalent visual quality. Use responsive images with the srcset attribute to serve the correct image size for each viewport, rather than loading a large desktop image on mobile devices.
A 40% improvement in LCP correlated with 28% more organic traffic for Nykaa, according to a web.dev case study. Image optimization paired with TTFB reduction is typically where gains of that scale originate.
Many teams install a caching plugin expecting LCP to improve immediately. Caching helps TTFB but does not fix a lazy-loaded hero image, a render-blocking script, or an uncompressed 2MB image. Work through each layer in sequence rather than applying a single solution and expecting it to resolve all LCP problems.
INP improves when JavaScript stops blocking the browser’s main thread during user interactions. The fix requires identifying which JavaScript tasks take too long, breaking them into smaller pieces, and deferring scripts that do not need to run on page load. This is the most technically demanding of the three Core Web Vitals to improve and typically requires direct developer involvement.
The browser processes JavaScript, user input, and rendering on a single main thread. When a JavaScript task runs for longer than 50ms, it is classified as a long task. During a long task, the browser cannot respond to user input. INP captures the total delay the user experiences from their tap or click to the next visible response.
INP replaced FID because FID only measured the first input. INP captures every interaction throughout the session. Sites that scored well on FID often failed INP because their pages became unresponsive after initial load as JavaScript continued executing in response to user actions.
Single-page applications built on React, Vue, or Angular frequently show elevated INP scores because client-side rendering generates substantial main thread JavaScript work. The 2024 Web Almanac recorded a drop in CWV pass rates for many JavaScript framework-based sites after INP replaced FID as the official responsiveness metric. Server-side rendering (SSR) and static generation of key pages reduce INP significantly by limiting how much JavaScript the browser must process on load.
CLS improves when every element on the page has a reserved space before it loads. Set explicit width and height attributes on all images, videos, ads, and iframes across the entire site. Reserve space for dynamically injected content before it appears. Eliminate late-loading fonts that cause text to reflow. These steps address the cause of the vast majority of CLS failures.
CLS has the highest pass rate of the three metrics, with about 79% of mobile pages achieving a good score. The 21% that fail frequently include high-value commercial pages: product pages with ad slots, landing pages with embedded forms, and article pages with dynamic content loaded after initial render.
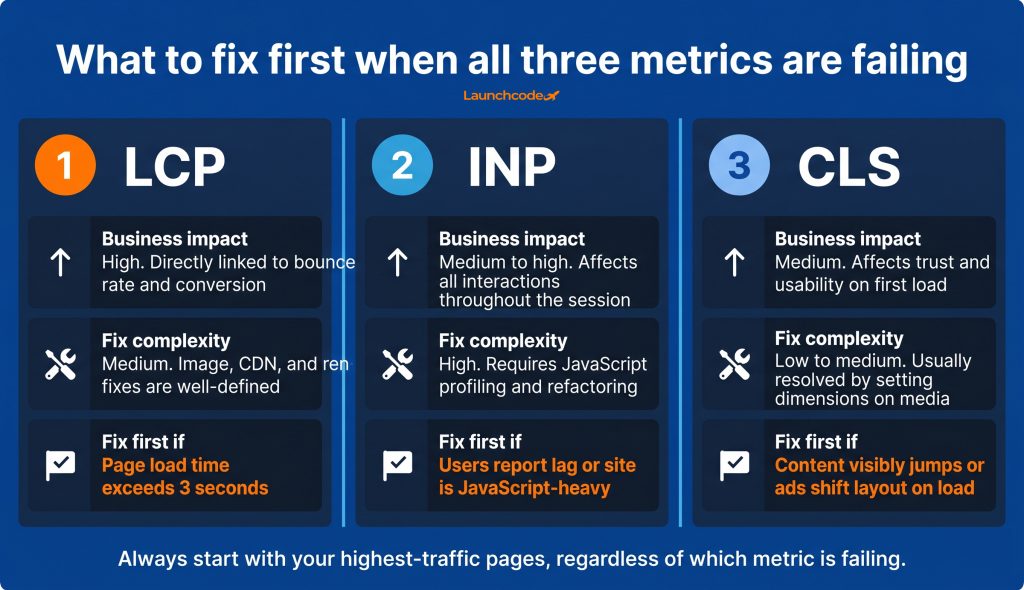
Fix LCP first because it has the strongest connection to bounce rate and conversion and the most established fix path. Fix INP second because it requires the most development effort and affects all user interactions after load. Fix CLS last because the fixes are more straightforward and the direct revenue impact tends to be narrowest. Always start with your highest-traffic pages, regardless of which metric is failing.
Use this framework when deciding where to begin:
| Metric | Business impact | Fix complexity | Fix first if |
|---|---|---|---|
| LCP | High. Directly linked to bounce rate and conversion. | Medium. Image, CDN, and rendering fixes are well-defined. | Page load time exceeds 3 seconds. |
| INP | Medium to high. Affects all interactions throughout the session. | High. Requires JavaScript profiling and refactoring. | Users report lag on interaction or site is JavaScript-heavy. |
| CLS | Medium. Affects trust and usability on first load. | Low to medium. Usually resolved by setting dimensions on media. | Content visibly jumps or ads shift layout on load. |
Run PageSpeed Insights on your highest-traffic pages first. If LCP is already passing but INP is in the poor range, prioritize INP. Follow the data from Search Console rather than working through metrics in a fixed order.
Improvements you make today will not appear in Google Search Console for approximately four to six weeks. CrUX data uses a rolling 28-day window. A fix applied today needs to accumulate 28 days of improved real-user data before the score fully reflects the change.
Teams that do not account for this often conclude their fixes did not work after one or two weeks and revert them or try different approaches prematurely. Set this expectation with your team before work begins. Record the date of each optimization, and compare Search Console reports month over month rather than week over week.
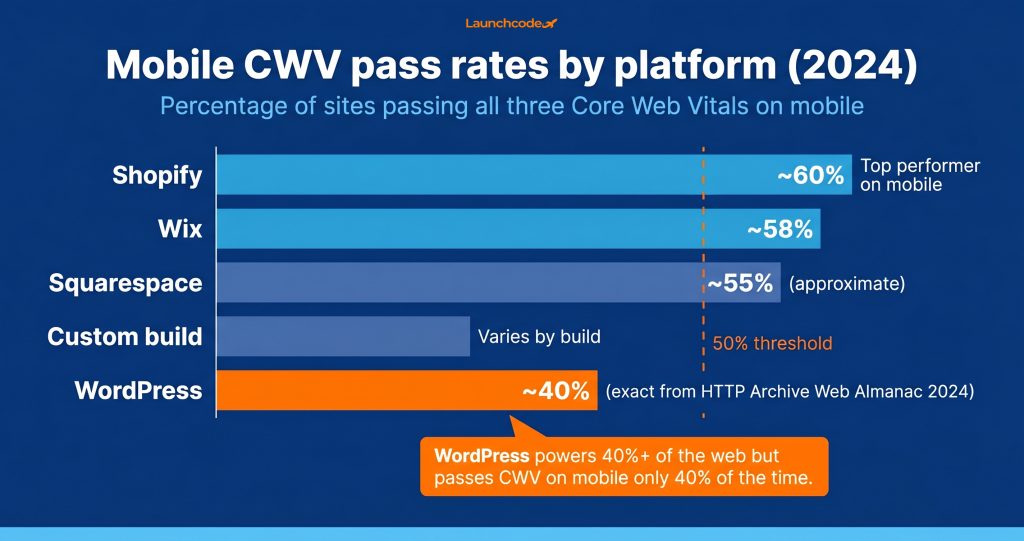
The platform your site runs on sets the performance ceiling. WordPress achieves only a 40% mobile Core Web Vitals pass rate. Shopify and Wix lead on mobile. Custom-built sites vary based on the engineering decisions made during development. Platform selection at the start of a project shapes how much optimization is possible without a rebuild.
According to the HTTP Archive Web Almanac 2024 CMS chapter, the gap between platforms is significant:
| Platform | Mobile CWV pass rate (2024) | Primary challenges |
|---|---|---|
| WordPress | ~40% | Plugin and theme script overhead, unoptimized images |
| Shopify | Top performer on mobile | App script accumulation on high-product-count stores |
| Wix | Top performer on mobile | Platform handles core optimization |
| Custom build | Varies widely | Depends entirely on developer architecture decisions |
WordPress sites accumulate JavaScript and CSS over time through plugins, page builders, theme updates, and third-party integrations. Each addition increases the work the browser must complete before content appears. Optimizing a WordPress site typically involves removing or replacing plugins, switching to a faster hosting environment, adding a CDN, and implementing server-side page caching.
Shopify sites generally pass CWV at higher rates because Shopify controls more of the underlying infrastructure. The main performance challenge for Shopify merchants is app script accumulation, where each installed app adds JavaScript that runs on the main thread and contributes to INP failures.
Launchcodex evaluates Core Web Vitals as part of every technical SEO audit and web development engagement because architectural decisions made early in a project determine how much can be improved without a full rebuild. Starting with a performance-aware foundation costs substantially less than retrofitting speed improvements onto a slow platform later.
Core Web Vitals scores degrade over time. New plugins, content changes, additional scripts, and campaign landing pages all introduce performance regressions. The sites that consistently pass CWV treat it as a continuous program with monthly monitoring, performance budgets enforced at the development stage, and regular comparison against competitors. A one-time audit produces one-time results.
Addy Osmani, who led Core Web Vitals development at Google for over a decade and now serves as Director of Google Cloud AI, described the scale of sustained effort: the CWV initiative saved Chrome users an estimated 30,000 years of waiting time in 2024, nearly tripling the 12,000 years saved in 2023. That result reflects sustained collective effort across millions of sites, not a single round of fixes.
As of December 2025, LCP and INP measurement is now supported across Chrome, Firefox, and Safari, following the Interop 2025 initiative. CLS support remains Chrome-only but is proposed for cross-browser inclusion in 2026. Real user monitoring tools now capture CWV data from a broader share of visitors, giving your team a more complete picture of actual site performance.
“CWV is not a one-time project. We track it monthly for every client because a new plugin or a campaign landing page can undo months of optimization in two weeks.” – Tanner Medina, Co-Founder & CGO
The good thresholds are LCP under 2.5 seconds, INP under 200 milliseconds, and CLS under 0.1. Google scores these at the 75th percentile of real Chrome user data. A page passes its Core Web Vitals assessment only when at least 75% of real visits meet the good threshold across all three metrics simultaneously. The current definitions are maintained at web.dev/articles/vitals.
Core Web Vitals are a confirmed Google ranking signal, but they are one of hundreds of factors. Content relevance, topical authority, and backlinks carry more weight in most situations. The clearest effect of CWV on rankings is as a tiebreaker: when two pages are comparable in content quality and authority, the one with better CWV scores tends to rank higher. In competitive search categories, that difference is significant.
PageSpeed Insights shows two types of data. The Lighthouse score at the top comes from a simulated test run in controlled conditions. The field data section shows real Chrome user data from CrUX when available. Google Search Console uses only field data. If real users experience slow loads because of their devices, network conditions, or location, the field data reflects that even when the Lighthouse simulation looks clean.
Google’s CrUX data uses a 28-day rolling window. After a performance improvement, it takes approximately four to six weeks for the change to fully appear in the Core Web Vitals report in Search Console. Record the date of each fix and compare Search Console data month over month rather than week over week. This prevents false conclusions about whether an improvement worked.
Google’s assessment is URL-based and grouped into clusters by URL pattern. Failing pages with low traffic have less impact on the overall site assessment than failing pages that attract a large share of visits. Start by fixing the URL groups in Search Console marked Poor that receive the most traffic. Improving high-traffic pages first produces the greatest impact on both the overall assessment and direct business metrics.


Real stories from the people we’ve partnered with to modernize and grow their marketing.